Dow charts and what they suggest.
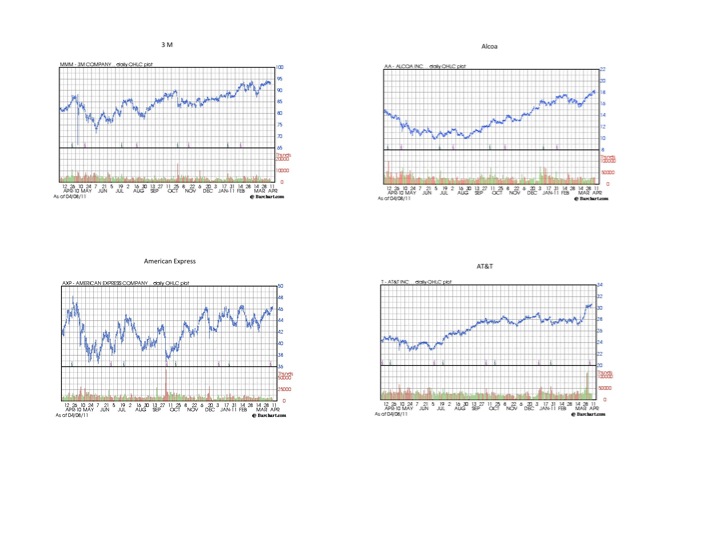
I have put together 1 year charts of some of the Dow 30 stocks below and the overall chart of the Dow Industrial average for a comparison. We are at a very critical juncture in the market right now as we have extended the rally now to what appears to be a peak, after having weathered a recent drop in March. The question on everyones mind is whether this means we are going to go higher on our way to 14,000, stay in a tight range or tip over. For some clues, looking at where individual stocks of the Dow are currently, might help us. A number of the stocks that make up the Dow, clearly show they have been leaders over the past year. Leading the gains in the composite Dow over the past year include CAT, DIS and HD. None of the other stocks gained as much from a percentage point of view. Here's a summary of the gains by stocks from the lows around May/June of last year to Friday's close in descending order of percent gains.
CAT 100%
AA 80%
DD 72%
CVX 69%
XOM 55%
GE 54%
PFE 50%
VZ 50%
HD 46%
KO 43%
T 38%
IBM 38%
DIS 38%
UTX 37%
JPM 34%
MMM 31%
TRV 30%
BA 29%
AXP 21%
MFST 19%
MCD 19%
KFT 18%
WMT 13%
MRK 10%
JNU 7%
PG 0%
INTC 0%
HPQ -6%
BAC -13%
CSCO -26%
THE OVERALL DOW JONES INDUSTRIAL AVERAGE HAD A GAIN OF 28% FOR THE SAME PERIOD.
Now, to get a sense of market direction in the coming weeks I decided to focus on the leaders to see what has happened in the past 3-5 days looking for weakness. CAT for example has turned down. AA has paused, as their earnings are to be the first released this week as earnings season begins. DO has also paused. CVX seems to continue to gain as OIL has gone over $110/barrel, so it's continued move up does have a context. The same is true for XOM, it's the price of oil. GE has turned down the past few days. So I have concluded that if Oil prices had not surged, this market would be dropping. Given that premise, oil prices shouldn't surge much from here, unless there are new problems in the Middle East besides Libya, say in Saudi Arabia.
I know the news of avoiding a shutdown of government is a good thing but I don't see much of a rally from it next week. If there is any rally, it should come from Earnings reports. I'm expecting the rally to stall and flounder. Other experts believe a rally is in order. This is definitely a real possibility but at the end of this last push higher is the precipice where stocks will drop sharply as the big scary decline begins. Below are a few of the charts for individual stocks in the Dow and the Dow itself.


CAT 100%
AA 80%
DD 72%
CVX 69%
XOM 55%
GE 54%
PFE 50%
VZ 50%
HD 46%
KO 43%
T 38%
IBM 38%
DIS 38%
UTX 37%
JPM 34%
MMM 31%
TRV 30%
BA 29%
AXP 21%
MFST 19%
MCD 19%
KFT 18%
WMT 13%
MRK 10%
JNU 7%
PG 0%
INTC 0%
HPQ -6%
BAC -13%
CSCO -26%
THE OVERALL DOW JONES INDUSTRIAL AVERAGE HAD A GAIN OF 28% FOR THE SAME PERIOD.
Now, to get a sense of market direction in the coming weeks I decided to focus on the leaders to see what has happened in the past 3-5 days looking for weakness. CAT for example has turned down. AA has paused, as their earnings are to be the first released this week as earnings season begins. DO has also paused. CVX seems to continue to gain as OIL has gone over $110/barrel, so it's continued move up does have a context. The same is true for XOM, it's the price of oil. GE has turned down the past few days. So I have concluded that if Oil prices had not surged, this market would be dropping. Given that premise, oil prices shouldn't surge much from here, unless there are new problems in the Middle East besides Libya, say in Saudi Arabia.
I know the news of avoiding a shutdown of government is a good thing but I don't see much of a rally from it next week. If there is any rally, it should come from Earnings reports. I'm expecting the rally to stall and flounder. Other experts believe a rally is in order. This is definitely a real possibility but at the end of this last push higher is the precipice where stocks will drop sharply as the big scary decline begins. Below are a few of the charts for individual stocks in the Dow and the Dow itself.



Labels: CAT, charts of Dow, CSCO, DIS, HD, market predictions, one year comparison
posted by Charles Amico at 10:25 AM
0 comments


