Saturday, November 12, 2011

Stock market: Where are we going?

I thought it would be worthwhile to look at this past week and see where we ended up. In my last Blog post, I cited the fact that the 200 day Moving averages appeared to be a significant resistance level for all major indexes. This week proved that point again as we ended the week with only the Dow above the 200 day MA. The S&P 500, the Nasdaq and the Russell 2000 all are still below their 200 day Moving averages. Until we can climb above these indexes we are stuck from going higher.

The Put to call ratio closed the week at 0.93, not exactly a buy signal. The sovereign debt issues in Greece and in Italy took center stage in the early part of the week. Then the resignation of Greece's Prime Minister and the signal that Berlusconi of Italy may resign next. ALL THESE MOVES CLOUD THE FACT THAT THE DEBT ISSUES AND AUSTERITY MEASURES NEEDED TO RESOLVE THEM HAVE YET TO BE IMPLEMENTED. Stay tuned as the volatility will continue for the next 6 months. Even if austerity measures are passed by the governments, the people will be heard on these matters in ways that will frighten many. The people have only begun to make their objections known to the world and their leaders. In true democracies, leaders can be voted out or feel enough pressure to resign. This crisis is just in its infancy.

Don't forget that there are now only 11 days left before our Super Committee must agree to cuts in spending or automatic cuts in the military will be implemented. My guess is they won't do what's necessary and the US will be downgraded again by the S&P and Moody's rating agencies.

Here are the charts promised earlier:


Labels: , , , , , , , , , , , , , ,

Saturday, October 22, 2011

Stock market analysis and commentary Oct. 22, 2011

The stock market had a surge yesterday on high volume and the Dow closed at a 11,808, bringing it near a 3 month high. Of course this was done on Options Expiration day. That explains the high volume, but not the surge up on the Dow. Yesterday also had one of the lower Put to Call ratio readings as seen in the chart below. Be sure to read my last post where I said to watch this ratio to go below 1.0 and head to a 0.7 reading.

What has dominated our stock market action has been Europe and the Greek debt crisis and impending crisis in Italy and Spain. there were some hopeful comments made that the meeting this weekend of the G-20 would yield some good results. Greece's Parliament did pass more austerity measures in the face of Union strikes and violence, all giving many hope that Eurozone countries will get past this problem and on solid footing. But Germany's Merkel has said to the effect, not to count much getting done at this meeting this weekend as it will take many more meetings and months or longer to solve these crisis. It didn't matter to the market traders as they jumped on the bandwagon of "hope" and drove stocks higher as the Shorts took it in their shorts with big hits in their portfolios.

The Dow trend has clearly broken above a tight range and it could have legs to go higher. I can envision a move to 12,000 is possible, but the risks to go back below 11,000 is also as strong. The 200 day moving average is at a few points below 12,000 but the line is sloping down so I don't see us going up above this level. See the 6 month chart of the Dow with the 200 day MA below:

Much will be dependent on the news from Europe. Many think that our earnings announcements will drive the market higher, but the fact is that many companies are missing their targets like Apple, The Blackstone Group, Schlumberger, Travelers Ins., Morgan Stanley ( missed w/o accounting move) and a number of other prominent companies. Remember most targets had been lowered because of the economy so even beating them is nothing really impressive with this very slow growth economy.

The best moves have been to play the wide swings in the markets due to high volatility. But this is not for amateurs. And I consider myself a amateur, as most are because we don't have the ability to execute High Frequency trade in nanoseconds like the big boys do, so we are always too early or too late for a trade to make comparable profits.

Labels: , , , , , ,

Friday, October 14, 2011

Market comments for Oct. 14th, 2011

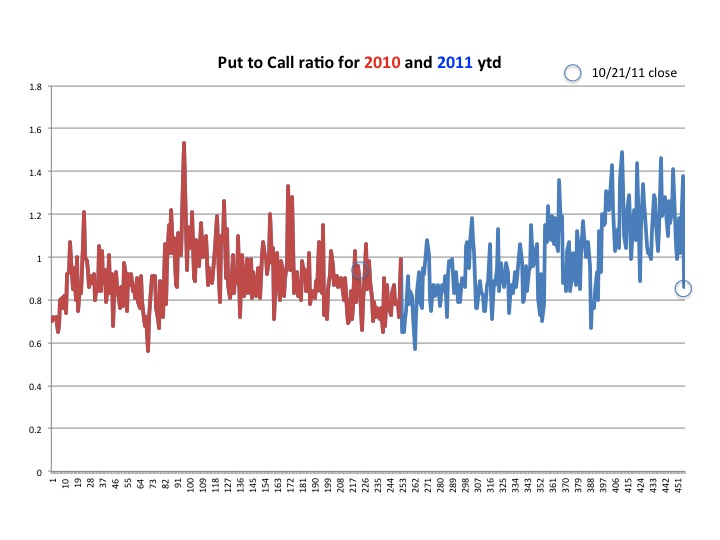
Today's focus is on the Put to Call ratio for all Equities and Indexes. The chart below shows this ratio for all of 2010 and Year to date for 2011. You can see from the chart that this ratio has been greater than 1.0 for all but 3 days since July 29th, the area under the red line. This while the stock market has rallied this past week. Many are wondering whether they should jump on this rally so they don't miss it. Some wonder whether there will be a sharp reversal and that this is a Bear trap. To answer this question, the Put to call ratio should help you decided. People believe there is a Bull market when the ratio is much lower than it is now. So one thing to watch is whether the Put to Call ratio daily readings start to consistently stay below 1.0 and start heading down to 0.7 or 0.6 or lower, but that's not where we are now. Paying attention of this data can help take out some of the anguish of trying to decide what to do.

Labels: , , ,

Saturday, September 10, 2011

Stock market summary and look ahead.

As predicted in yesterday's post, the markets sold off. The Dow closed down 303 points to 10,992, again breaking below the 11,000 level. Looking at the 3 month chart of the Dow, it has been easier for the Dow to go below 11,000 than it has to go over 11,500. The pressure is to the down side. And all the news is to the downside as well. You can see from the chart below that the blue line of the 400 day MA is proving to be resistance as well.

A big test for the Dow is soon coming. The 52 week low is at 10,458 and this will be tested and new lows will be set, in my opinion.

I was at a Berkeley Art Gallery (ACCI) opening show for some of my wife's art and her friends last night. It was a good show. One of the artist husbands and I were discussing the big drop in the market yesterday and he suggested that the drop was because of President Obama's speech. I suggested that this was not the reason for the drop and that it was the European Central Bank's Chief Economist quitting over disagreement with the purchasing of Eurobonds by the ECB. (read yesterday's post). European turmoil will continue to lead our markets direction and I fully expect it to get worse with all markets eventually returning to test the lows of 2009. This level corresponds to 6,400 on the Dow, 675 on the S&P 500 and 1300 on the Nasdaq.

Caution is the word going forward. If you are in cash, you have no worries about the market. If you are long this market I would be protecting my assets by either selling some stocks and taking some money out of the market, or I would hedge my longs with some shorts or even buying some ETF's which go in the opposite direction of their underlying stock Index. This is no time to be taking big risks. The Put to Call ratio has been over 1.00 for the past 29 out of 31 trading days. That is extraordinary!

Labels: , , , , , , ,

Friday, August 26, 2011

Market comments for Aug. 26th 2011 (UPDATE)

This morning, the second estimate for GDP for Q2 came in at 1.0%. The first estimate was 1.3%. Also, Michigan Sentiment data will be released just before Bernanke speaks at 10:00am. Expectations are for 55.8% and I will update this post at that time. Gold is up in European trading $23/ounce. All European markets are down about 1% or more at this time. Dow Futures as well as the S&P and Nasdaq are also down in premarket.

Germany’s DAX Index (DAX) ended the day yesterday with a 1.7 percent loss, recovering from an amazing 15- minute plunge of 4 percent.

Ahead of Bernanke’s speech today, traders hedged their investments by selling DAX futures, lifting volume to a quarter of the daily average within a 30- minute period. That dragged down the index, pulling equities in the U.S. and throughout Europe lower, and drove Treasuries and the dollar higher yesterday.

European markets closed yesterday, then French, Italian and Spanish stock-market regulators extended bans on short selling introduced this month. Lots of nervousness out there.

Federal Reserve Chairman Ben S. Bernanke begins a speech in Jackson Hole, Wyoming, at 10 a.m. New York time.

UPDATE 6:24am PST

The Put to call ratio has been up over 1.0 for 20 consecutive days. The last time it was below 1.0 was July 26th, one month ago to the day. To me this says that the markets have been very bearish, even though there has been rallies, and that the trend is believed to continue to be bearish and the market will go down. That's where the money is now! Where's yours?

Come back for the Michigan Sentiment data in about a half hour.

UPDATE 655am PST

Michigan Sentiment came in close to expectations. The reading was 55.7 versus an expectation of 55.8, so not much difference and much better than last month's reading which came in at a 54.9 reading.

Labels: , , , , , , ,

Tuesday, June 21, 2011

My Big Fat Greek Vote at midnight tonight. UPDATE

That's right, tonight a drama plays out in Greece, where Greek Prime Minister George Papandreou faces a vote of confidence vote by Parliament. That is the first of the hurdles he must pass. If he succeeds with the vote of confidence, then he must gain approval for tough austerity measures so that Greece will be bailed out by other European countries. It is going to be full of drama for sure. What else to expect from the passionate Greeks?! :)

While markets are up this morning, don't bet long here as there are a series of moves that must take place to kick the world debt crisis can down the road. But for now, we get the market bounce. I would advise paying attention not only to this drama playing out, but also the drama here at home with the debt ceiling negotiations taking place between the Democrats and the Republicans and lead by VP Biden. Oh, and watch for another pronouncement by the Fed on passing the Debt Ceiling limit as soon as possible and not to continue to play brinkmanship with it.

In the mean time, yesterday's market did end the 13day streak of the Put to Call ratio exceeding 1.00, as it closed with a 0.89 reading. Continue to watch the market for lower highs and lower lows with a zig zag pattern in effect.

UPDATE: 4:00pm PST
Greek Prime Minister George Papandreou won a vote of confidence, bolstering his new government’s chances of pushing through austerity measures to secure further international financial aid for the country.
A total of 155 lawmakers supported the motion in the 300- seat parliament in Athens early this morning, with 143 voting against,

Labels: , , , , , , , , ,

Saturday, June 18, 2011

It's official! The PC ratio reached 13 consecutive days greater than 1.00

It's official, the Total Put to Call ratio of Equities and Index Options has now exceeded 1.00 for 13 consecutive days, as of the market close yesterday. As mentioned the past 3 days, this is the first time this ratio has had this many consecutive days greater than 1.00 since June 26th, 2008.

It turns out that was the quiet period before the storm to come over the next 9 months. That was a period where we were just learning of the concerns of the Sub Prime problem affecting our economy. and by March of that next year the Dow crashed from the 11,500 level down to the 6,500 level, as is shown in the chart below.

Whether history will repeat itself this time around is anybody's guess. But with all the tampering of the monetary policy by the Fed and a weak stimulus package having little effect on job creation, God only knows where we are headed in the next year. From my vantage point it doesn't look good unless the country has the stomach and courage to do another real stimulus package for this economy like was done during the Great Depression. We need a real new WPA program. But the wealthy and their puppets in Congress want nothing to do with it. As long as they already have theirs socked away, why take the chance and invest in lower income Americans called the Middle Class, they say. I say we had better! What do you say?

Met a really nice guy last night who writes Financial books and has edited some of the classics on Trading and Technical Analysis. Had a great time talking with him. A shout out to Charles!

Labels: , , , , , , , ,

Friday, June 17, 2011

Market comments for June 17th: Put to Call ratio analysis

Something a little different today for my most faithful readers, I have some charts you will only find here. I have recently been comparing the period of June 2008 to June 2011 because we have recently logged in 12 days now of the Put to Call ratio exceeding a 1.00 reading. I thought today a bit more refinement was in order to see what can be learned from a more in depth analysis.

To start with let me explain some of the data. There are Options of Puts and Calls taken out on stocks (Equities) and on the Indexes, like the Dow or S&P500. When I have reported to you that the Put to Call ratio has exceeded 1.00 for 12 consecutive days, I have included all of these Options in a Total reading. Today I am going to break down Equities from Indexes and am going to look at 2 periods, all of June of 2008 vs. June 2011 to the close yesterday.

Below are 4 charts. 2 of the charts are of the Equity volumes for 2008 and 2011 and 2 are for the Index volumes for 2008 and 2011. As you can see from all 4 charts that only one chart seems to have a real trend and that one is for Index Puts and Calls, (that is the first chart) and that the volume not only is trending but also that it exceeds all other Options Volumes for both periods.


To me this means that the biggest bets being made right now are being made for an overall market drop, hence the Index Put options rising to significantly higher volumes in 2011 than in 2008, before the major market correction down to 6,500 on the Dow. It seems to me that this time people are putting their money where their mouth is. Traders see that it isn't specific stocks which will tend to be hit in a correction, but rather the entire market. That is something to take note of.

UPDATE: 7:52am PST

Also of significant note today is that Options expire for the month of June and for the Quarter. Expiring equity, P.M. settled index options and treasury/interest rate option classes cease trading. Expiring cash-settled currency options cease trading at 12:00 p.m. EST. This is why the Volume is already over 148 Million shares in just a little over an hour this morning.

The Michigan Sentiment Index came in below expectations this morning for June. A reading of 71.8 is below expectations, which was 73.5 and below last month's 74.3 reading.

Labels: , , , , , , , ,

Tuesday, June 14, 2011

Market comments for June 15th: Astonishing!

The Put to Call ratio today closed once again above the 1.00 level this time reaching 10 consecutive days the ratio has reached this occurrence. The last time the Put to Call ratio had a run like this was starting on June 26th, 2008 where for 13 consecutive days a 1.00 Put to Call ratio was observed. In the chart below, I have circled both occurrences with red circles and arrows pointing to both periods.

In the chart below, the Dow Industrials average is plotted so that you can see what turbulence followed just after the June 26th, 2008 period. It started the big selloff in the market.

The real question to ponder right now is whether we are at the precipice of the decline, as we were at roughly this time in 2008 as you can see from the chart. That was the beginning of the drop all the way down to Dow 6,500. Back in June 26th 2008, the Dow was at 11,500, which wasn't too far from where we are starting now, is it? :) Only time will tell and it will be hindsight as that. Coincidence or correlated? Cause or Effect? That is the real question. Astonishing!

UPDATE: 5:45am PST

The Core CPI for May came in at +0.3% or an annual rate of +3.6. Also, the Empire State Index dropped from + 11.88 in May to -7.79 in June and that isn't good! Dow Futures are down about 110 points and the Nasdaq Futures are down about -20 points. Adding to the drop in the Futures is the riots in Greece over the austerity required to get bailed out by the EU. The people don't want any part of it and have turned unfortunately to violence in the streets as tear gas and water cannons are now targeting those protesters.

Labels: , , , , , , , ,

Friday, June 10, 2011

Market comments for June 10th

The market gain yesterday in the Dow and other indexes might have been impressive, fist glance when you consider the Dow gained 75 points to close at 12,124, but of note to me was that the volume was less than the previous 3 days this week in the chart below. That is not the kind of bottoming out of a declining market that one would expect.

Of additional note has been the Put to Call ratio of this week, as is shown in the chart below. Pay particular attention to the little red line average of this week's data at the end of the chart. It is clearly above the recent trend line. The graph is of the Put to Call ratio from Oct. 2nd, 2008 to the close of the market yesterday. The Put to Call ratio has exceeded 1.00 for 7 consecutive days as of the close yesterday. This has not occurred since the period from Oct. 2nd-Oct 9th, 2008. So take note of where we are right now. We are at the beginning of where the final crisis started in 2008, comparing the 2 sets of Put to Call ratio data that had 7 days in a row above a 1.00 reading!


Today's Futures point lower and while I would expect a continued bounce today to close the market to the upside, This recent decline has more steam to go lower. As the issue of raising the debt ceiling becomes more of a game of chicken with politicians, I think this will take its affect on the markets. I think we are headed to test 11,600 in the coming week or two.

Labels: , , ,

Saturday, June 04, 2011

Market commentary: Looking ahead to a critical juncture in the markets and the country

Before giving an outlook for the week ahead, I think it important to review where we are now and as usual I will be using a number of unique charts to se where we are and see if any trend emerges for a higher probability market call. To start this off I would like to focus first on the Dow.

In the chart below I have made a custom chart of the Dow from January 1st, 2010 to the close of the market yesterday, June 3rd. You will notice that I have drawn 2 blue trend lines showing the uptrend of the Dow one starting in July 2010 and the other more vertical line starting around Sept. 1st 2010. We are currently touching this line and will see whether we break below it next week or not. If we do break below it then the other lower line becomes the next major support level. You will notice that this week there was also a Volume spike with the selloff this week as is indicated in the lower chart. You will also notice that I have placed several dates on this chart which will be important to look at on a chart of the Put to Call ratio in my next series.

You can see from the chart below of the Put to Call ratio for the same period of all of 2010 and to the close of the market yesterday, that the Put to Call ratio closed yesterday at a reading of 1.24 and that the Put to Call ratio had not gone that high since 9/10/10. Compare that date on this chart to the chart above of the Dow and what happened after that high a reading was reached. The Dow started its climb which lasted almost a year.

The key to me here is to look at the Put to Call ratio for 1/2 the time before the 9/10/10 date. It was a period of higher variation in the ratio and correspondingly a wilder time in the Dow. There was a higher Put to call ratio of 1.53 during that period as you can see on the chart from a Dow of 11,200 down to a Dow of 9,800.

This next week is very critical for the market. If we break below the current uptrend line we could go much lower. With all the lack of action by the Congress on raising the debt ceiling, this is just adding gasoline on a potential firestorm. Within the next 30 days, Moody's is going to consider whether to lower the U.S. rating from triple AAA causing huge problems around the globe. This is an irresponsible action of Congress. Playing chicken with the debt crisis is similar to what Newt Gingrich did during the Clinton Presidency and shut down the government, but much worse. Back then it only affected U.S. workers and the American people some of which didn't get their Soc. Security checks. But this time we are giving the middle finger to the world and especially those who hold our debt and will not be so eager to fund our debt in the future should we default. These are very dangerous times.

So what would I do right now? I would be defensive right now. I wouldn't be a buyer of stocks until the trend became clearer. I would take some money off the table so if the market drops, I have locked in any profits I have gained over the past year. Watch the Put to Call ratio daily and see if we are going higher. While normally a 1.24 reading would be a Buy signal, we could get much higher Put to Call ratios in the near term and all they might be saying is not to be a buyer quite yet as there is a lot more downside.

Also, look at the Treasury Bond yields just from April 25th. I have been recording the data daily and this chart says that all interest rates have dropped, from a 3 month to a 30 year and I might add rather quickly. Ask yourself this question, why has the Fed wanted the interest rates so low and going lower? People on Fixed income are getting creamed. It's like the Fed is trying to get everyone to look for riskier investments and get their money out into circulation to "stimulate" the economy more. the 30 year Treasury Bonds are at only 4.21%.

Now that the Fed and our Government has taken on all the risk, they seem to want to unload that risk on you and me and our children and grandchildren's lives. There is a temporary solution to this. If we could come up with legislation to increase the debt limit, which must be raised no matter what else we do, then that would calm the markets. Then the Congress needs to identify a minimum of $4 Trillion it is going to reduce the national debt and still invest in certain growth ares where we must. Republicans and Democrats need to stop the idealogical battles and start to put the country first and find savings across the board. Defense must be trimmed, healthcare needs simplification and technology improvements, Foreign aid needs not to be routinely given, but subjected to new criteria as to whether they do something for America There should be some strings on repatriation of corporations funds abroad, so that if corporations are allowed to bring money back, they must create meaningful manufacturing and service jobs here to compete better in the world and ensure the survival of our Middle Class and our economy. We need high speed rail in America. It would mean less emissions and less pollution from cars. And the wealthiest Americans must pay more taxes! Let's get on with it!

Labels: , , , , , , , ,

Sunday, May 22, 2011

Put to Call ratio for 2011 in focus

I thought today I would show a chart of the Put to Call ratio for all of 2011 with special focus on last week's movement. The chart below indicates this past week's movement in blue. The put to call ratio is an important indicator for me as it often indicates the best time to buy and sell stocks.

The reading on this past Tuesday of 1.15 had not been hit since March 16th, when the ratio hit a high of 1.18. You can see from the Dow chart of March 2011 below, that on March 16th the market hit a low and then then within 2 days started a rally. The data point was actually a Buy signal, if you were paying attention that day. From that point, the market rallied a minimum 7 % to this past Tuesday or if you sold a little earlier with a gain of 1000 on the Dow, you would have made a profit of 8.6%, which is very good in only a few months.

Now looking at where we are on the Dow chart below for the month of May, you will see the Dow's action for this past Tuesday the 16th, when the Put to Call reached a high of 1.15, that the chart pattern for the last 3 days May 18th-20th is different than that of March 16th in the chart above. I would look for another drop in the market this week going below the May 17th low. We shall see if the phrase "Sell in May" comes true!

Labels: , , , , ,

Wednesday, March 16, 2011

Market comments for March 17th, St. Patricks Day! UPDATE

I am sorry to say but it appears tonight that the trading tomorrow will not result in a day in the Green, for St. Patrick's day. As it looks tonight, the Nikkei 225 has opened down about 350 points and our markets on Wednesday were accelerating down near the close. As the charts of the S&P 500 and the Dow show, the trend down is gaining speed and suggests more movement down before we get a bounce up.


It is clear to me that we have broken well below previous support levels and by extending previous lows you can see where the next level of support is and they are much lower. For the Dow, it means we most likely are going down to 11,400 and for the S&P 500 we most likely will go down and test the 1160 level. The Put to Call ratio at 7:00am PST this morning was at 1.99 but closed for the day at 1.17, which is still the lowest it has been in some time.

Today the Dow closed at 11,613 and the S&P 500 closed at 1256. When we go down to these levels many are going to wonder if we are on our way to test the 11,000 level on the Dow. The answer is yes, we are going below 11,000 and then we will test the 10,000 level, so be prepared for more losses if you haven't headed my warnings from previous posts. Notice that in the past 5-6 trading days we have wiped out 2 months of gains. That's how quick we can go down.

The data on Initial Jobless Claims will be out at 5:30am PST on March 17th as will Continuing Claims.

In the meantime, please send a contribution to the Red Cross effort to help Japan. It will make you feel good and you will be doing something really good for people who are suffering.

UPDATE: 5:55am PST

Dow Futures are now up 107 in pre-market so now it is anyone's guess where the market will close today. Maybe we will have a bounce up as the Bulls predict, but the data on Initial Jobless Claims came in at 385K, while expectations were for 380K. Surprisingly, the CPI for February came in at +0.5% and that is an annual inflation rate of 6%. That is not a good reading. That was before Oil rose significantly and suggests that March's CPI will be higher.

If we do get a bounce up today, plan it to be still a lower high than before. As I have repeatedly said, we will have lower highs and lower lows. Stay tuned! Happy St. Patrick's Day!

Labels: , , , , , , , ,

Thursday, January 20, 2011

Market comments for Jan. 20th

I was asked by a close friend of mine why I didn't post about the market this morning. I said to him because nothing is any different in the market from my comments on Monday. The Put to Call ratio signaled a Sell signal on Jan 14th and I said that it may take a day or two or as much as a week, but the Dow has dropped a minimum of about 800 points when the readings of the Put to Call ratio was that low. In the charts below I have a 3 month chart of the Russell 2000, symbol RUT, and the S&P500, the nasdaq and the Dow. You will notice I have placed the charts in an order in terms of which has broken below their 9 day MA as well as the 18 day MA. So they are arranged from the order of most correction so far. Expect all the Indexes to correct and go below their 9 day and 18 day MA.


Today the Put to call ratio intraday had a high of 0.98 and a low of 0.81 and closed at 0.93 for the day.

Labels: , , , , ,

Monday, January 17, 2011

The Put to Call Ratio warns again. Are you listening this time?

It should be a quiet day today as the Banks and Stock Markets are closed here in the U.S. for observance of Martin Luther King Day. For those missing market action I decided to recap where we are and what data, if any, was noteworthy from Friday. Well, I found one small piece. It was the Put to Call ratio at the close on Friday. It came in at a 0.57 reading. I thought you would need a context for that reading and so I have included 3 charts below. The first is the Put to Call ratio from Oct. of 2003 to the close on Friday.

As you can see from the above chart, a reading of 0.57 is on the rare side and falls outside the normal range of data with a 95% confidence level. I have identified various dates when a reading this low or lower occurred. Why is this reading important? Well, it is because often it is a sell signal for stocks. I said here, often, not always. The other two charts below are of the Dow. The same dates have been identified on those two charts. The first chart is the Dow plotted linearly and the second chart is the same data plotted on Log scale. Log scale shows a more dramatic change than a linear scale does. Here are those 2 charts.


I think it is quite clear that in all cases in subsequent days following the readings the markets dropped. Some times, like Mar. 16, 2006, it was a small drop of about 800 points and other times it was the massive selloff we experienced where the Dow dropped almost 8,000 points.

We may still rise a few days or a couple of weeks, but we are in store for another correction of at least that 800 points but we could also be at that tipping point of thousands of points again. According to Elliott Wave Theory, we are in for a doozie of a correction all the way to the depths of hell by the time it is complete. These things don't happen in a matter of days months or year. It can take years to unfold but one thing is for sure, when they do come they bring sizable pain. I am not expecting the same levels of depth as does Elliott wave Theory prognosticators, but I do see a drop of at least 5,000 points for the Dow coming and a retest of 6,400 low registered in 2009, which I believe will fail as well in the end. Even the Fed won't be able to stop it when it starts. Not only won't Bernanke be able to stop it but all the Kings horses and all the Kings men won't be able to put Humpty Dumpty back together again!

The real important question to ask yourself is this. What if what I am saying does happen? What actions will you take? Will you start to buy on the dips as the market starts dropping and be buying too prematurely, only to see you selling the stocks you bought and repurchasing them again a bit lower? Or will you just Hold on to your stocks in hopes of a quick turnaround? Or will you be like a Deer in your headlights and be frozen into no action at all? These questions are worth asking yourself. You see they can be grouped in categories like these: Reactive, Responsive and Proactive. Which strategy will be best for you and what does that actually mean? As I learned as a Boy Scout: Be Prepared!

Now for a little light humor. You might call this post today in honor of Dr. Martin Luther King: I have had a Bad Dream!

Labels: , , , , , , , , , , ,

Wednesday, January 05, 2011

Dow Gold ratio hits new recent high today

The often watched Dow/Gold ratio today hit 8.6 and it has not been this high since August 11th, 2010. Everyone has been focused on the recent rise of the Dow, but few have been commenting on the corresponding drop in Gold prices. Today Gold closed at $1368/ounce after a recent high was reached of $1421 on Nov. 9th and $1420 again on Dec. 7th. But since Dec. 7th the speculative Gold market has been selling off slowly. That's about a 3.7% drop in Gold prices, while from Dec. 7th the Dow has gone up 369 points or 3.2%.

This may not appear as significant but if the speculation on Gold has turned, can the stock market speculation end be far away? I don't know but this market, with the Fed's help has maintained a rally and I believe it is in its final gasps to surge one last time before exhaustion settles in. I have been wrong before and I might be wrong again here but I am telling you I believe we are all in for a rude awakening when this market starts to drop to levels which scare people again. It is coming and each day the market rises, we are one step closer.

The chart below is a daily chart I have kept on the Dow/Gold ratio for all of 2010 and the first few days of 2011. I plan to continue to keep this data base going and from time to time I will post them here. Remember the other significant point I call your attention to is the Sell Signal the Put to Call ratio flashed in the first hour of trading 2 days ago when it had a 0.37 reading. We are just so overbought it is pathetic.

Labels: , ,

Tuesday, January 04, 2011

Put to Call ratio hits SELL signal low.

The Put to Call ratio has just hit a new recent low of 0.37 at 7:00am PST. This is flashing a SELL signal for anyone willing to pay attention to it. The stock markets are so overbought right now that, in my view, you buy stocks at your own peril. The last time I have seen it this low on a close for the day was when the Dot.com Bubble burst. Be alert and flexible. This Bubble is about to burst!

I will post the Put to call ratio during the day as the data is available, as I did yesterday:

7:00am PST 0.37
7:30am PST 0.49
8:00am PST 0.57
8:30am PST 0.60
9:00am PST 0.57
9:30am PST 0.61
10:00am PST 0.62
10:30am PST 0.62
11:00am PST 0.63
11:30am PST 0.64
12:00pm PST 0.65
12:30pm PST
1:00pm PST

Labels: , , ,

Monday, January 03, 2011

Jan. 3rd mid morning comments on the stock market

As the Put to Call ratio had indicated last Friday, 12/31/10, the ratio came in at 1.37 and was a Buy signal. This morning the market surged up 125 points by 8:00am PST and the Put to Call ratio has now backed off to 0.59, which is almost a Sell signal. Look for the Put to Call ratio to be as low as 0.54 or lower to signal a Sell. This looks like very high volatility coming over the next few weeks.

Update: 9:00am PST
Here is the data on Put to Call this morning 1/2 hour at a time. I will update it for the whole day as the data comes in.

7:00am PST 0.73
7:30am PST 0.68
8:00am PST 0.59
8:30am PST 0.61
9:00am PST 0.60
9:30am PST 0.61
10:00am PST 0.59
10:30am PST 0.60
11:00am PST 0.64
11:30am PST 0.65
12:00pm PST 0.62
12:30pm PST 0.63
1:00pm PST 0.64

Labels: , ,

Friday, December 24, 2010

What will be the first sign of an impending market correction?

I think the question is on many minds these days, but most likely not on Christmas Eve. So this is for the wandering Internet travelers who say, Bah humbug over Christmas and are looking for some predictions or interesting tidbits of information about the stock market. In the chart below I have shown the current trends in the Put to Call ratio and what data point should signal the impending market correction.

I most likely won't be posting any more today or tomorrow but will be back here on Monday when the market is open. In the meantime, wishing you a very Merry Christmas. Drink some Eggnog and just chill.

Labels: , , , ,

Tuesday, December 14, 2010

Put to Call ratio hits new low (UPDATE)

The Put to Call ratio this morning within the first half hour hit a new low of 0.47. This is after closing last night at 0.65. This new low is to me a definitive sell signal and is the lowest I have seen in the past 3 years or longer. Traders beware. There is too much optimism out there and when everyone is going in the same direction, there is bound to be a major reversal as there most likely are no more buyers other than Ben.

UPDATE: 8:20am PST
Traders, noticing the same thing started buying Puts because at 7:30am PST the Put to Call ratio climbed to 1.09 and at 8:00am was at 1.06 and it is obvious others are looking to go short on this market too.

UPDATE: 11:45am PST
The Put to Call ratio has continued to stay above 1.00 since my earlier update. Currently at 1.00 after spiking to 1.13 earlier. The Dow hit a new 52 week high today as well.

Labels: , ,

Technorati Profile