Thursday, March 31, 2011

Market comments for March 31st, 2011

I was listening to Art Cashin, of UBS Financial Services, on CNBC this morning, and he said that if we just had a few of the recent upheavals of Governments in the Middle East or concerns over a default of governments like Greece or Portugal, or an Earthquake of magnitude 9.0 in Japan followed by a tsunami and then a Nuclear Power Plant meltdown, any one of these normally would have caused the stock market to have tanked with at least a 10% correction. That is an interesting thought to ponder as it has been Fed Chairman Ben Bernanke who has single handedly kept the stock market artificially up at these lofty levels. Listen to Art Cashin below.


It is extremely difficult to time the market normally but with Bernanke using the printing presses of the Federal government, it is nearly impossible to predict the stock market moves. This is not good for the long run because when there is a disconnect from reality, there will be an unforeseen negative impact to our country, which will be much larger than any stock market drop would cause, That is where we're headed and there appears no way to prevent it. As a close friend of mine has stated to me many times, "We are all finished!" I would add that we are not now built on the Free Enterprise System, but rather a manipulated, controlled government which protects the wealthiest of us and doesn't care at all about the Middle Class or worse, the Poor and no better than that.

It's the end of the 1st quarter at the close of the market today. But tomorrow we will hear the Unemployment Rate numbers which doesn't count all of our unemployed. Most expect the number will "look" better. It's April Fool's Day too and if you believe the numbers the government discloses, then you too are a fool! We seem to be a gullible populace, aren't we. Just look at all the Birther's in the Republican Party. :))

Labels: , , , , , , , , , , , ,

Saturday, March 26, 2011

The recovery is just coming along nicely as he had foreseen, says the Emperor Ben Bernanke in Star Wars

Today's post should get you to think about your investments in a way maybe you hadn't before. Do you remember the Public Service announcement which used to say, "Do you know where your kids are?" Well I ask you the same today about your investments. never has this question been more important. The market has had an extraordinary recovery in 2010 and it appears has in this first quarter of 2011. Many analysts and critics alike have professed the Bull market has returned. Could this be true? Let's take a look at the news and data coming out this first quarter and enjoy the recovery to its fullest.

Let's start with the Unemployment rate. According to the Bureau of Labor Statistics (this sounds mathematical doesn't it? ), the Unemployment rate is now at 8.9% having come down from a high of 9.8%. That is real progress, wouldn't you say? I don't think you have a PhD in Mathematics, but I think you can do a minor calculation. Here's the question, how should you calculate the Unemployment rate? Should it be calculated by counting the total labor force divided by the number of people not working? If you answered yes, you would be correct. But that is not how it is calculated. It is calculated by taking the number of people receiving unemployment benefits divided by the total labor force. So if people have run out of Unemployment benefits they are not counted as unemployed, nor are people who have given up looking for work, nor those who can only work part time as there are no full time jobs available. Interesting isn't it. It used to count anyone not working back in the 1930's and it too was reported by the Bureau of Labor Statistics. Back then the Unemployment rate was about 20-25%, depending on which month you are talking about. But that was during the Great Depression. If you use the same formula for today's calculation, it has been reported the real unemployment rate is around 18-20%, not that far from the same rate during the Great Depression. Here in the chart below is the reported Unemployment rate since 1950.

OK, let's be more optimistic and focus on some world news that would give us a sense that things are getting better. Oil prices have surged in recent weeks to over $106/barrel. Many believe it is a temporary spike. After all there are a few minor concerns in the Middle East right now. The latest concern is of Libya and Gaddafi. His people have grown tired of him, are feeling little to no hope for a better life since prices for food have soared in recent months as have prices for many goods and precious metals like Gold and Silver. Oh, and besides Libya, there were riots and the ensuing departure of several other Middle East leaders in Tunisia and Egypt who also succumbed to their uprising of the citizens call for their ouster. In recent days, riots have occurred in Bahrain, Syria, and now Jordan and it appears that instability has taken hold of the entire Middle east over rising prices and the lack of any opportunity for the citizens of these countries to have a better life for themselves. They feel hopeless. Remember the protests in Iran last year and the brutal attacks of that government by its people? More protests will happen there as the Iranians see country after country seeking to remove their leaders. And yes, even Saudi Arabia has seen protests and the government has tried to appease the people by giving workers raises and bonuses. Where do you think Oil prices are going to go? I'll bet not down!

But wait, there is good news, the recovery has been steadily improving, just look at the facts. The stock market has gone up, thanks to Fed Chairman Ben Bernanke intervening to support the stock market. How has he done this? By printing money out of thin air. Now I know this has devalued the dollar but I am told that the dollar is strong by the main authority on this matter, Treasury Sec. Tim Geithner. That should be good enough, right? Well there has been a run-up in Gold and Silver to record highs, There must be some correlation there to our currency value. The chart below shows the value of an average home in terms of ounces of Gold needed to purchase it. You will notice that this index has dropped significantly in recent years. What it means is that it takes the same number of ounces to buy your home today as it did back in 1983. That's because the value of Gold in U.S. Dollars has soared and the value of your homes has dropped. Scary, isn't it!

And all this talk about changing the U.S. Dollar from remaining as the Reserve currency of the world must be idle chatter, even though it has been discussed at the IMF (International Monetary Fund) as well as by countries like Japan, Russia, China and some Middle Eastern countries as well. Remember $0.42 of every dollar we spend is for the interest on our debt. That is unsustainable and is part of the reason there is talk of changing the status of the US. Dollar as the Reserve Currency of the world. The Chinese have stopped buying our short term debt as have the Japanese with all the problems they face now because of the Earthquake, Tsunami and now Nuclear reactor meltdowns. Our supplies from japan will significantly be impacted which will affect 2nd, 3rd and 4th quarter GDP here in the U.S. We haven't yet been impacted as the shipments to the US have only begun to stop. All electronics from there will be affected as will the auto industry as many parts are made in Japan for the US Auto manufacturers.

But wait, our recovery has been making steady progress and we are doing well, according to Fed. Chairman Ben Bernanke. Of course he says that we must reign in the debt at the appropriate time and has asked law makers (politicians) to set in place a plan to get serious to reduce the debt as it is unsustainable for the long run. But politicians and the President alike have refused to do anything meaningful to address entitlements like Medicare and Social Security or the gigantic Defense Budget Spending, so here we are as we enter election year politics. See, things are better! Fourth quarter 2010 GDP was reported yesterday to be 3.1%, revised up from the previous estimate of 2.8%. That was 6 months ago and they still are playing with the numbers to show us we did good last year. Let's look at the chart below of GDP since 1950 and see how we are doing now.

As I look at this chart on GDP, I am not impressed. It is clear that during the Bush years, and especially the latter years of his Administration, we were not expanding and we haven't been doing that well for a very long time.

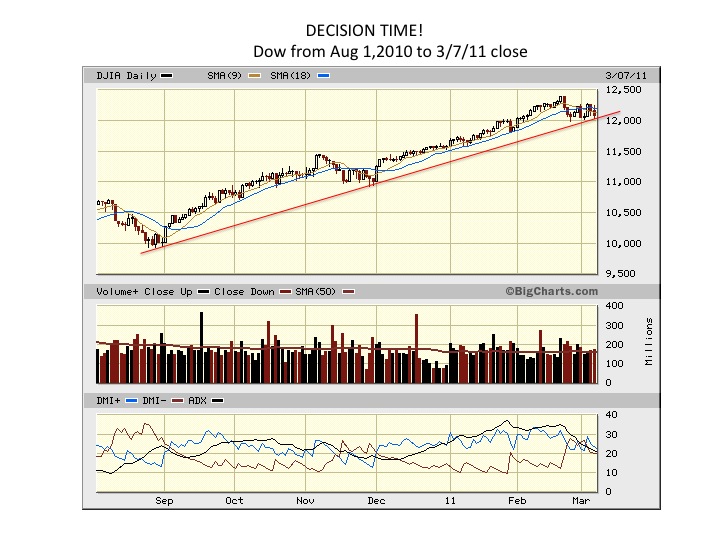
Last but not least, I thought I would show the chart of the Dow focusing again on the volume of this latest rise. You will see in the chart below that this week had prices rising with an unconvinced investor as the volume dropped sharply this week. So much for the bullish case. When prices rise and volume drops this is definitely a bearish sign that the market is about to turn down sharply and that the Bull is tired. So much for Bernanke's manipulation of the market. He has made it much worse. But in the end, the Emperor loses if you remember your Star Wars stories. FAIR WARNING!!!

Labels: , , , , , , , , , ,

Friday, March 25, 2011

Chart of the day. The Dow from 1900 to 2011

Today's post from Chart of the day. For some long-term perspective, today's chart illustrates the Dow adjusted for inflation since 1900. Of interest is that the inflation-adjusted Dow has traded within the confines of an extremely long-term upward sloping trend channel over the past 111 years. It is also of interest that the secular bear market that concluded in the early 1980s was almost as severe as the one that concluded in the early 1930s. Also, while the market action from the inflation-adjusted record high of 1999 to the financial crisis lows of 2009 was severe, the magnitude of this decline was much less than what occurred with the bear markets that concluded in the early 1930s and early 1980s. More recently, the Dow has retraced 74% of the financial crisis bear market with the inflation-adjusted Dow currently trading 19% off its 1999 record high -- a rather dramatic turnaround considering the magnitude of the recent financial crisis. The chart is plotted on Log scale.

Labels: , , , , ,

Thursday, March 24, 2011

Market comments for March 24th

The data is in for today and the Dow, S&P 500 and Nasdaq all climbed once again. This is in spite of the fact that Factory Orders were down 0.9%, as expectations were for a +0.2% gain. You most likely have heard that Initial Jobless Claims were down. Let me share the real data.

Initial Jobless Claims came in at 382K. Now the previous week they were at 385K Initial Jobless Claims. What the media didn't report was that expectations were for the number this week to come in at 370K. So while they brag because it is 3K better than last week, they don't say anything about the fact that they are more than 10K more than were expected. So much for truth reporting.

As I stated earlier, Durable Goods Orders for February came in at -0.9%, while expectations were for +0.2%. Last Month the reading was +3.6%, so the change was significant and not a help to the economy.

Labels: , ,

Has the stock market really gone up? A look at the Dow Gold ratio

I have updated my recent charts on the price of Gold and also the Dow/Gold ratio and I find it quite revealing in light of the bullishness of those in the stock market and investor sentiment numbers being at near record highs. As you can see from the chart of the price of Gold, we have set a new record high this week. Of course that is the price of Gold in US dollar currency. The Dow/Gold ratio from the other chart shows that the trend continues to go down. Many investors in the stock market have felt very good at the gains they have made in the past year or so. You see since January 1st, 2010 to March 23, 2011 the Dow has gained about 13.9%. On the surface, that would appear to be a fabulous year, wouldn't it, that is unless you compare it to the price of Gold. Gold has risen in the same period over 33%. Now that is a big gain. So if you consider Gold a standard to measure your progress financially in real assets, you have lost significant ground based upon this data. Still feel good?


This all happening with the help of a Fed whose job has been to try and help the recovery using another round of Quantitative Easing (QE2), or as many like to call it, printing money out of thin air. The consequence of this is that in order to purchase a 1 ounce gold bar a year ago you would have needed 39% less dollars than today. Taking the same analogy consider for a moment the real value of Real Estate on a Gold basis if you really want to be depressed. We all know housing prices have dropped significantly around the country and many consider the absolute value in dollars as their yardstick. But it you consider that while housing prices have dropped about 10% over the past year in dollar terms, the value of properties, as measured in ounces of Gold, those houses have really dropped in value and the numbers are staggering. That's what's happening to our Country. You can buy US assets in Gold or Oil today at far cheaper prices than what we mentally think is their true worth. Depressing, to say the least. Of course if you have a lot of Gold, or Oil, you can buy much of America today for a bargain. But who would want it? Below is a chart of Housing Prices in terms of ounces of Gold to purchase a home.

Labels: , , , , , , ,

Monday, March 21, 2011

Market comments for March 21st and the week

It was not surprising this morning that the market is up. The Dow is up 165 in early trading to 12,027 and the S&P 500 is up to 1295, all because of 2 things. First the success with the No-Fly Zone in Libya and secondly because of the fact Friday was Options expiration lat week. Let's face it the news isn't that good with Oil this morning up another $2.00/barrel. Many expect this trouble in Libya to end badly for Libyans. Don't forget we are dealing with a mad man in Gadhafi. And as they say the acorn doesn't fall far from the tree and he does have several sons, who are by his side in all of this mess.

Expect this week that we will form a lower low than we did last week at the Dow will make a try at going below 11,400. We have had 3 strong rallies the past 3 trading days and I think that string of moves is about finished.

Last week I purchased the Agricultural ETF, symbol DBA for $32.60, as I see agricultural commodities rising with oil prices surging on Middle East concerns as well as of Japan's nuclear reactor concerns and recovery from the Tsunami and earthquake. I expect DBA to go to $36 in the short term because of these problems.

And on the political front, the Republicans are not dealing with the debt issues except in very small ways. So the mountain of debt we have is still rising with this republican Congress and this unwilling President who has his eyes only on 2012 and not making any mistakes. He has been absent on this issue for fear of angering constituents. But that's not leading at all, I'm sorry to say!

Labels: , , , , , , , , , , ,

Wednesday, March 16, 2011

Market comments for March 17th, St. Patricks Day! UPDATE

I am sorry to say but it appears tonight that the trading tomorrow will not result in a day in the Green, for St. Patrick's day. As it looks tonight, the Nikkei 225 has opened down about 350 points and our markets on Wednesday were accelerating down near the close. As the charts of the S&P 500 and the Dow show, the trend down is gaining speed and suggests more movement down before we get a bounce up.


It is clear to me that we have broken well below previous support levels and by extending previous lows you can see where the next level of support is and they are much lower. For the Dow, it means we most likely are going down to 11,400 and for the S&P 500 we most likely will go down and test the 1160 level. The Put to Call ratio at 7:00am PST this morning was at 1.99 but closed for the day at 1.17, which is still the lowest it has been in some time.

Today the Dow closed at 11,613 and the S&P 500 closed at 1256. When we go down to these levels many are going to wonder if we are on our way to test the 11,000 level on the Dow. The answer is yes, we are going below 11,000 and then we will test the 10,000 level, so be prepared for more losses if you haven't headed my warnings from previous posts. Notice that in the past 5-6 trading days we have wiped out 2 months of gains. That's how quick we can go down.

The data on Initial Jobless Claims will be out at 5:30am PST on March 17th as will Continuing Claims.

In the meantime, please send a contribution to the Red Cross effort to help Japan. It will make you feel good and you will be doing something really good for people who are suffering.

UPDATE: 5:55am PST

Dow Futures are now up 107 in pre-market so now it is anyone's guess where the market will close today. Maybe we will have a bounce up as the Bulls predict, but the data on Initial Jobless Claims came in at 385K, while expectations were for 380K. Surprisingly, the CPI for February came in at +0.5% and that is an annual inflation rate of 6%. That is not a good reading. That was before Oil rose significantly and suggests that March's CPI will be higher.

If we do get a bounce up today, plan it to be still a lower high than before. As I have repeatedly said, we will have lower highs and lower lows. Stay tuned! Happy St. Patrick's Day!

Labels: , , , , , , , ,

Monday, March 14, 2011

Market comments for March 15th UPDATE

Japanese stocks overnight had a terrible day dropping over 1000 points. The Futures are showing a drop in all US Indexes of about 1.5% to 2.3%. The continuing explosions at the Nuclear Reactors are causing concerns all over the world where Nuclear Reactors are used. Many lessons will be learned here in the next few years but for now panic is settling in all countries, including the U.S. It's hard not to see a connection to the Japanese stock market and the troubles in Japan as the cause of our market drop. But our market started to drop much before the Earthquake in Japan.

I expect the market to drop again and then have a rise but the rise will be a lower high than before and we will continue to make lower lows as I have stated here for a number of weeks. If you don't want to sell your stocks, then buy a hedge like some Ultra Short ETFs like TZA, SOS, FAZ and any others that go inverse of the Indexes they represent. It will help cushion your losses. But again, think if this is a longer drop, it might be better to sell now and take some profit and repurchase much later when stocks are cheap. The chart below is my best guess at Tuesday's action in the Dow. Notice the constant slide of the Dow drop.

UPDATE 5:40pm PST

Here is the actual chart of the Dow after the close today.

Labels: , , , , , , , ,

Sunday, March 13, 2011

Should we tap the Oil Reserves to help lower the price of Oil?

That is the question this morning on Candy Crowley's CNN program this morning. Sen. Dick Durbin believes we should and Candy pointed out to the Senator that President Obama says it should be used for supply shortages not to just lower the price of oil. There were no facts presented as to how many days supply do we have today and would using the Oil Reserves really prevent a setback to our economy if we don't use it. So here is one fact. There are about 726 Million barrels of Oil in our Strategic Oil Reserves. That supply would last only 34 days! Now here's the question for you given that bit of new information: Should we use the Strategic Oil Reserves to ease gas prices?

Source of data on Strategic Oil Reserves.

Labels: , , , ,

Friday, March 11, 2011

Market comments for March 11th

Much news in the world today. There is the big 8.9 magnitude earthquake in Japan with a Tsunami following. There is the trouble in Libya, the unrest still in Egypt, and new protests in Saudi Arabia. But if that isn't enough, the Michigan Sentiment for March came in at only 68.2, while expectations were for a 78.0 reading. That is a huge drop and most likely based upon the recent rise in Oil prices because of the trouble in Libya and Egypt. The prior reading was a 77.5 reading. The reading today was the lowest since Oct. 2010. See the chart below.

The market is meandering today after the big sell-off yesterday. It has been both down and up today but the total range is about 94 points today for the Dow. It does not change my view that we are headed lower next week.

Labels: , , , , , ,

Thursday, March 10, 2011

Market comments for March 10th and some political comments as well

Not much has changed with respect to the stock market as a result of yesterday's action. As I said several days ago we have formed a wedge of an ever tightening range. This means we are getting closer to that breakout either to the upside (which I do not believe will happen) or to the downside, which is more likely in my view. Conditions in Libya are getting more precarious daily, as rebels are pushed back by Kaddafi's mercenaries. Today's jobless claims report rose more than expected and came in at 397K, just shy of the 400K. This set a negative tone in futures this morning.

The chart below of the S&P 500 shows that wedge and how the range tightens each day. Today the market is starting lower but it is down now almost 200 points on the Dow and may actually break below the range today. Watch for any breakout to confirm market direction going forward.

In Wisconsin, the Republican Senate stripped out the Collective bargaining section of a bill which had financial elements so the Bill could be passed with the Democrats away from the State to protest the maneuvers to kill the Unions. This issue is becoming a rallying point for Democrats who see Republicans tied to the business sector push to remove Unions from being a factor in the next election. The Unions have organized for Democrats and gotten out the vote and helped fund many a campaigns. Getting rid of Unions will allow big business with their hordes of cash to dominate the process, thus ensuring Republican candidates win. When they win they will remove all remaining regulations on Wall St. They are waging a war on the Middle Class and with this last effort, they are winning. The people must take to the streets or this illegal move will stand. These tactics are being pursued in 16 northern states,

UPDATE 7:00am
Here is the updated chart of the S&P which includes the early market trading. It clearly shows we have broken lower and outide the recent tight range!

Labels: , , , , , , ,

Tuesday, March 08, 2011

Market comments for March 9th trading

Market action on Tuesday, while an impressive gain from the day's drop on Monday, kept both the Dow and the S&P 500 within an even tighter range. The Bulls are using the day's progress as evidence we are still in a Bull market. The problem is the charts say otherwise. It isn't so clear that we are still in a rising market.

The 2 charts below clearly show that in the past 5 market days the range has been tightening. You will notice that both on the Dow chart and the S&P chart we are forming lower highs and higher lows. This is setting up a breakout either to the upside or to the downside. It is impossible to guess which way it will go, especially because the Fed can trump any downturn with more QE2 funds to prop up the market. Stay tuned to see where we wind up. Oh, and by the way, in the last 15 minutes today over 40 million shares were traded by Institutions!

Labels: , , , , , ,

Market comments for March 8th, 2011

It appears as though we are approaching a very critical time for the Dow. We are within days of testing the uptrend support line and whether the market will break lower or rise. Based upon world events it doesn't appear the news is favorable for a market rise with concerns over $200/barrel oil according to a Bloomberg.com story this morning because a Day of Rage has been called now for Saudi Arabia.

As the chart below shows, we are at the edge with time running out.

As I have stated clearly here many times, we are headed down in my opinion and it is going to get very ugly for those who did not take profits yet and are hoping we climb much higher. Greed is not your friend here.

Labels: , , , , , ,

Thursday, March 03, 2011

Tax rates during FDR's time.

With the situation in Wisconsin and the attempt by Gov. Walker to stop Collective Bargaining by State employees. I watched today a conversation on Cable news where people were quoting FDR and that he was against Unions back in those days and said he didn't think employees should have the right to strike if they were government employees. So I thought tonight I would shed some historical perspective to what pundits are claiming was the situation. So this below from Wikipedia about what was the tax rate back then compared to now.:

During World War II, Congress introduced payroll withholding and quarterly tax payments, Franklin D. Roosevelt tried to impose a 100% tax on all incomes over $25,000 to help with the war effort. For tax years 1944 through 1951, the highest marginal tax rate for individuals was 91%, increasing to 92% for 1952 and 1953, and reverting to 91% for tax years 1954 through 1963.

So when they discuss Union rights one must take into account that the tax rate back then for top earners was 91%. It was much more fair, although there were tax loopholes. Today's top tax rate for the wealthy is only 35%.

The issues in Wisconsin are complicated but focusing on breaking the Unions does not serve the State. Get on with governing and stop the drama!

Labels: , , , , ,

Market comments for March 3rd, 2011

Europe has been up in their markets this morning in advance of our Initial Jobless Claims numbers which were released at 5:30am PST. Expectations were for 400K and the Prior period data from last week was 391K. Today's number cam in at 368K Continuous Claims, which under-reports those who remain without work but not those who have either given up hope or are under-employed using part time work to survive, came in at 3.77 Million Claims. Q4 Productivity came in at 2.6%. This shows workers continuing to be extremely productive and thus removing the necessity for employers to have to hire more workers. Unit Labor costs were down 0.6% for Q4, which could mean that companies made more profits at the expense of workers.

I have attached 2 charts this morning of the Dow. One is the latest 3 month chart which shows we are forming a short Head and Shoulders pattern. The pattern would indicate a leg up is due today. On the 1 year chart I have drawn 3 red lines showing the various bands of support visible. If we penetrate the lower red line, it will mean we are on our way down in the market and the downtrend is convincing. My guess, based upon a Dow Gold ratio of 8.5 would mean that the Dow would rise today to 12,104, about a 38-50 point gain today, because Gold is down today to $1424/ounce. We shall see.

Labels: , , , , ,

Tuesday, March 01, 2011

Market comments for March 1st, 2011

The stock market closed up yesterday so many feel we are returning to new highs. It isn't going to happen! In every market drop there are a series of jagged patterns which make one think the market is rising. However you will notice that each move up is a little lower than the previous high and eventually a lower low is formed. I believe we are currently in that pattern. So I predict that we will not return to the previous high but will be going below the most recent low within a week or two as the market continues its decline.

The economic news yesterday was nothing to excite people, but the Fed was most likely behind the rise. Personal Spending was down for January, Also, Pending Home Sales for December were down.

One chart of the Dow for a 3 month period is being posted today. It shows the recent drop and the latest climb the past few days. I expect that the Dow will not return to 12,400 but will instead go below 12,000 in the next week or two, as it begins its expected steady decline.

A Friend and I were looking at the Dow/Gold ratio chart below yesterday, which covers from 1980 to Jan. 31st, 2011. He believes we will return as low a ratio as 1.1 as we were back in 1980. Certainly form the trend starting in 2000, we have continued to decline to a ratio of 8.5-9.0 most recently from a very high ratio. The red dot on this chart is where the ratio was, as of Friday's market close, so we continue to drop in this ratio.

Now yesterday I was asked a question about the reverse split of TZA and what I thought about it. Well truthfully, not much, as as the questioner had pointed out, the value of the ETF remains the same in a reverse split. But it can have a psychological impact on some because they think that the ETF must rise so much more than it did before the split, for them to break even or make a profit from where their average purchase price was. Yes it does have to move up more $ dollars now than before the split, but percentage wise it is exactly the same. So again, I don't worry about it at all.

Labels: , , , , , ,

Technorati Profile