Thursday, August 04, 2011

Market comments for August 4th.

Weekly Initial Jobless Claims numbers were released this morning amidst an environment of a negative Futures market. Initial Jobless Claims for July 30th came in at exactly 400K and the previous week's data of 398K was revised to 401K. Continuing claims came in at 3.730 Million.

The Dow Futures was down about 120 before the data was released due to worldwide jitters on economies across Europe and an attempt to lower currencies to increase exports to the US. The US Dollar is rallying against all major currencies today.

Tomorrow we will get the Unemployment data for the month of July. Much of the data is already known, because we have had 4 weeks of 400K claims or more and the only factor in the Unemployment data will be the seasonal adjustments made to it by the government. WE also know about 4000 FAA employees are having to claim unemployment insurance due to Congress not passing legislation before recess to fund the agency. We also know about 70,000 Construction workers had to stop work at airports across the country because of lack of funding by Congress. So if anything is clear, there is a higher chance the unemployment number will go up instead of down or it will remain at least at 9.2%. If seasonal factors have a larger factor than expected, the Unemployment rate could rise to not just 9.3%, but 9.4%. Stay tuned for this important number tomorrow.

It is clear the markets have broken the 200 day MA's as well as broken through previous support levels. Therefore I believe we still have a way to go before a reversal to the upside happens. There just isn't any good news out there right now except higher earnings reported for the second quarter for many companies. But this is hollow news for the average person who is just trying to survive.

Yesterday I sold my TZA Call Options for Oct. (at a Strike price of $41) for $7.00 each. I paid $2.69 and $2.81 for these, just 2 weeks ago. TZA had risen to $44.95/share yesterday for a high, but then closed at $41.02 on very high volume.

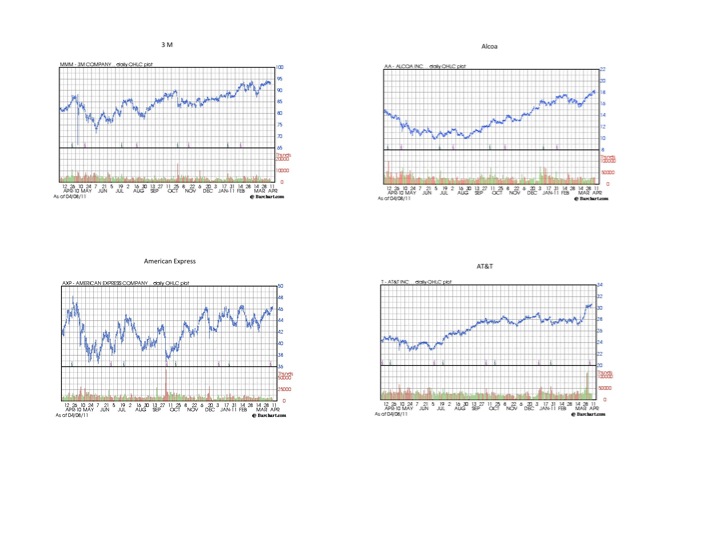
The chart below shows the Dow for the past year and I have drawn a support line where I think the Dow must go before a significant bounce up. As you can see it is at 11,500. That will be the first support level which must be tested. So we still have about 350 points to drop on the Dow.

Labels: , , , , , ,

Friday, June 24, 2011

Market comments for June 24th

Which way will today's market play out? That is what I have been asking myself. The market had been down over 200 points yesterday but managed to stage a comeback and close down only 59 points on the Dow. But as you can see from the 3 month chart below, there was a definite Sell signal confirmed with a Hammer Candlestick pattern not only for the Dow, but also for the other major indexes like the S&P 500. Notice also the higher volume yesterday on the lower chart of the Dow 3 month chart.

But still the market did save over a 200 plus drop in the Dow and that gave me pause. So I pealed back some of the data to see what the charts are telling me going into today. Below you will notice a 2 day chart of the Dow in 5 minute increments. This chart clearly shows the surge back up from the lows and does show a slanted upwards "W" pattern or Head and Shoulder pattern going into the close.

So as we are within a few minutes of the open, I believe today will be a struggle between the Bulls and the Bears for control. Watch the range be tight for most of the day as the Volatility will drop. Watch volume as it should be less than yesterday as well.

There are still major issues to be dealt with like the impasse of the Congress to raise the debt ceiling and you know all is still not well in Greece. So if I had to bet, I would say we have a higher chance of ending down today than up. Of course, on the other hand, the Fed still has some influence in manipulating the market with still some funds left to spend before the end of June. Maybe we should all just go away and come back in the Fall after all. :)

Labels: , , , , , , ,

Tuesday, June 14, 2011

Market comments for June 15th: Astonishing!

The Put to Call ratio today closed once again above the 1.00 level this time reaching 10 consecutive days the ratio has reached this occurrence. The last time the Put to Call ratio had a run like this was starting on June 26th, 2008 where for 13 consecutive days a 1.00 Put to Call ratio was observed. In the chart below, I have circled both occurrences with red circles and arrows pointing to both periods.

In the chart below, the Dow Industrials average is plotted so that you can see what turbulence followed just after the June 26th, 2008 period. It started the big selloff in the market.

The real question to ponder right now is whether we are at the precipice of the decline, as we were at roughly this time in 2008 as you can see from the chart. That was the beginning of the drop all the way down to Dow 6,500. Back in June 26th 2008, the Dow was at 11,500, which wasn't too far from where we are starting now, is it? :) Only time will tell and it will be hindsight as that. Coincidence or correlated? Cause or Effect? That is the real question. Astonishing!

UPDATE: 5:45am PST

The Core CPI for May came in at +0.3% or an annual rate of +3.6. Also, the Empire State Index dropped from + 11.88 in May to -7.79 in June and that isn't good! Dow Futures are down about 110 points and the Nasdaq Futures are down about -20 points. Adding to the drop in the Futures is the riots in Greece over the austerity required to get bailed out by the EU. The people don't want any part of it and have turned unfortunately to violence in the streets as tear gas and water cannons are now targeting those protesters.

Labels: , , , , , , , ,

Sunday, June 12, 2011

Market comments for the week ahead and beyond

Let there be no doubt, the Dow will go as low as 11,600 shortly. From there we may have a bounce up but the odds are we will continue to see this and the other stock market indexes drop lower because much concern still lies with the issue of raising the debt ceiling. We have less than 3 weeks for this issue to get resolved before the markets start to get very nervous and volatile, even though we have until Aug. 2nd before the government defaults on its debt obligation and the government shuts down. The sides are still miles apart and it seems to be playing along in a similar game of chicken as to when Newt Gingrich was the Speaker of the House during the Clinton Administration. The Republicans miscalculated then and appear to be again now. Only this time the consequences our governments credit will face is much worse as the United States has never defaulted on its debt obligation. So you see this is very serious indeed.

I have added a 6 month chart of the Dow this morning as is seen below. Notice that on Friday, which is often a low volume day, the Dow was down 172 points at the close. Notice also that the Volume was indeed higher than the entire rest of the week.

Also noteworthy was the fact that the Put to Call ratio continues to be greater than 1.00 now for 8 consecutive market days, not seen since Sept. 9, 2008. All the signs are warning investors this is serious. Don't say you didn't know it would get so bad. You have been warned!

How far down is the market going to go is subject of many guesses. My guess is that we will be first going all the way down to the 10,000 level after testing 11,600. A look at the 2 year chart below shows just how easy the Dow and other Indexes can unwind. I have identified 3 levels to test in what could be a drop as far down ultimately to test the Dow at 6,400. Yes, that's right, Dow 6,400. You read that correctly. Much depends on when and what the Fed is allowed to do. If the Fed stops its quantitative easing (QE2) and not do more, we could get there sooner rather than later. If the Fed decides it needs QE3, this drop and crash will be postponed for a while, but it will be inevitable, we will crash to test 6,400 eventually. A defense will be better than any offensive market move going forward as the odds are against a Bull market now. Fair Warning! We are in a Bear market now.

Labels: , , , , , , , , ,

Friday, June 10, 2011

Market comments for June 10th

The market gain yesterday in the Dow and other indexes might have been impressive, fist glance when you consider the Dow gained 75 points to close at 12,124, but of note to me was that the volume was less than the previous 3 days this week in the chart below. That is not the kind of bottoming out of a declining market that one would expect.

Of additional note has been the Put to Call ratio of this week, as is shown in the chart below. Pay particular attention to the little red line average of this week's data at the end of the chart. It is clearly above the recent trend line. The graph is of the Put to Call ratio from Oct. 2nd, 2008 to the close of the market yesterday. The Put to Call ratio has exceeded 1.00 for 7 consecutive days as of the close yesterday. This has not occurred since the period from Oct. 2nd-Oct 9th, 2008. So take note of where we are right now. We are at the beginning of where the final crisis started in 2008, comparing the 2 sets of Put to Call ratio data that had 7 days in a row above a 1.00 reading!


Today's Futures point lower and while I would expect a continued bounce today to close the market to the upside, This recent decline has more steam to go lower. As the issue of raising the debt ceiling becomes more of a game of chicken with politicians, I think this will take its affect on the markets. I think we are headed to test 11,600 in the coming week or two.

Labels: , , ,

Saturday, April 09, 2011

Dow charts and what they suggest.

I have put together 1 year charts of some of the Dow 30 stocks below and the overall chart of the Dow Industrial average for a comparison. We are at a very critical juncture in the market right now as we have extended the rally now to what appears to be a peak, after having weathered a recent drop in March. The question on everyones mind is whether this means we are going to go higher on our way to 14,000, stay in a tight range or tip over. For some clues, looking at where individual stocks of the Dow are currently, might help us. A number of the stocks that make up the Dow, clearly show they have been leaders over the past year. Leading the gains in the composite Dow over the past year include CAT, DIS and HD. None of the other stocks gained as much from a percentage point of view. Here's a summary of the gains by stocks from the lows around May/June of last year to Friday's close in descending order of percent gains.

CAT 100%
AA 80%
DD 72%
CVX 69%
XOM 55%
GE 54%
PFE 50%
VZ 50%
HD 46%
KO 43%
T 38%
IBM 38%
DIS 38%
UTX 37%
JPM 34%
MMM 31%
TRV 30%
BA 29%
AXP 21%
MFST 19%
MCD 19%
KFT 18%
WMT 13%
MRK 10%
JNU 7%
PG 0%
INTC 0%
HPQ -6%
BAC -13%
CSCO -26%

THE OVERALL DOW JONES INDUSTRIAL AVERAGE HAD A GAIN OF 28% FOR THE SAME PERIOD.

Now, to get a sense of market direction in the coming weeks I decided to focus on the leaders to see what has happened in the past 3-5 days looking for weakness. CAT for example has turned down. AA has paused, as their earnings are to be the first released this week as earnings season begins. DO has also paused. CVX seems to continue to gain as OIL has gone over $110/barrel, so it's continued move up does have a context. The same is true for XOM, it's the price of oil. GE has turned down the past few days. So I have concluded that if Oil prices had not surged, this market would be dropping. Given that premise, oil prices shouldn't surge much from here, unless there are new problems in the Middle East besides Libya, say in Saudi Arabia.

I know the news of avoiding a shutdown of government is a good thing but I don't see much of a rally from it next week. If there is any rally, it should come from Earnings reports. I'm expecting the rally to stall and flounder. Other experts believe a rally is in order. This is definitely a real possibility but at the end of this last push higher is the precipice where stocks will drop sharply as the big scary decline begins. Below are a few of the charts for individual stocks in the Dow and the Dow itself.


Labels: , , , , , ,

Friday, March 25, 2011

Chart of the day. The Dow from 1900 to 2011

Today's post from Chart of the day. For some long-term perspective, today's chart illustrates the Dow adjusted for inflation since 1900. Of interest is that the inflation-adjusted Dow has traded within the confines of an extremely long-term upward sloping trend channel over the past 111 years. It is also of interest that the secular bear market that concluded in the early 1980s was almost as severe as the one that concluded in the early 1930s. Also, while the market action from the inflation-adjusted record high of 1999 to the financial crisis lows of 2009 was severe, the magnitude of this decline was much less than what occurred with the bear markets that concluded in the early 1930s and early 1980s. More recently, the Dow has retraced 74% of the financial crisis bear market with the inflation-adjusted Dow currently trading 19% off its 1999 record high -- a rather dramatic turnaround considering the magnitude of the recent financial crisis. The chart is plotted on Log scale.

Labels: , , , , ,

Tuesday, March 08, 2011

Market comments for March 9th trading

Market action on Tuesday, while an impressive gain from the day's drop on Monday, kept both the Dow and the S&P 500 within an even tighter range. The Bulls are using the day's progress as evidence we are still in a Bull market. The problem is the charts say otherwise. It isn't so clear that we are still in a rising market.

The 2 charts below clearly show that in the past 5 market days the range has been tightening. You will notice that both on the Dow chart and the S&P chart we are forming lower highs and higher lows. This is setting up a breakout either to the upside or to the downside. It is impossible to guess which way it will go, especially because the Fed can trump any downturn with more QE2 funds to prop up the market. Stay tuned to see where we wind up. Oh, and by the way, in the last 15 minutes today over 40 million shares were traded by Institutions!

Labels: , , , , , ,

Thursday, March 03, 2011

Market comments for March 3rd, 2011

Europe has been up in their markets this morning in advance of our Initial Jobless Claims numbers which were released at 5:30am PST. Expectations were for 400K and the Prior period data from last week was 391K. Today's number cam in at 368K Continuous Claims, which under-reports those who remain without work but not those who have either given up hope or are under-employed using part time work to survive, came in at 3.77 Million Claims. Q4 Productivity came in at 2.6%. This shows workers continuing to be extremely productive and thus removing the necessity for employers to have to hire more workers. Unit Labor costs were down 0.6% for Q4, which could mean that companies made more profits at the expense of workers.

I have attached 2 charts this morning of the Dow. One is the latest 3 month chart which shows we are forming a short Head and Shoulders pattern. The pattern would indicate a leg up is due today. On the 1 year chart I have drawn 3 red lines showing the various bands of support visible. If we penetrate the lower red line, it will mean we are on our way down in the market and the downtrend is convincing. My guess, based upon a Dow Gold ratio of 8.5 would mean that the Dow would rise today to 12,104, about a 38-50 point gain today, because Gold is down today to $1424/ounce. We shall see.

Labels: , , , , ,

Saturday, February 19, 2011

Dow 30 year chart: What is it telling us?

As we begin a long 3 day President's weekend, I thought a look back on this stock market climb. At first glance the Dow chart below shows a downward slanting "W" pattern, or, as many technical people call it, a Head and Shoulders pattern. But while that's an important point of this chart as the recent climb has been impressive, what I want you to look at is the bottom chart which is of Volume over the past year. You will see on that lower chart an average volume red line but notice in the last year the volume has declined to a low of the past 10 years. When volume is strong and price is increasing it is quite Bullish. When price rises and volume declines significantly, that is quite Bearish. In this case, there is no question that the entire climb of the past year has been on very low volume. You see it has been climbing without the individual investor participation. This rise has exclusively been down by the Fed and it is not sustainable indefinitely. The longer this market goes up, the bigger the fall. Don't be greedy. Take your profits and be happy you have them. Keep what you have then in cash and just wait.

Click on the image to enlarge it if you can't make out the details.

Labels: , , , , ,

Saturday, February 12, 2011

Looking back on the stock market for predictions of what's to come.

This will be a particularly long post today. I have gone back in time to see what I wrote back on Saturday, Sept. 4th, 2010 about the stock market and at that time the coming election, along with the stock market charts of that time to see what came true and what didn't. What's the point of this, you ask? Well in part because I was wrong in some of my predictions because I had no idea the impact of QE2 by the Fed and what that was going to be. Remember, that was pre election time and just a few weeks after Bernanke announced QE2. The stock market had reached what I thought was going to be its peak before the beginning of its long decline. I thought that top was at 11,400 on the Dow. I was proven wrong on that one.

So here is my entire post from that Saturday back on Sept. 4th, 2010 followed by an update to my thinking:

I believe in the coming few weeks there will be a great battle in the stock market for the very soul of the market. One group of players will be those Bears, who like me, believe we have been lied to and the markets manipulated to keep us happy. The other players are the Bulls, who believe the lies of the Government and the Fed and think things have been getting slowly better.

I do believe the stock markets will drop significantly in Sept and Oct., set up a angry Consumer and Electorate, who will then go to the polls in November and vote to "throw all the bums out". This will be followed by a Republican victory in the House of Representatives, which will mean a return to endless investigations using the new subpoena powers they will have in the Congress and they will continue to stop all legislation on Energy, Healthcare and of course any Social agenda to help the Unemployed.

A stock market rally will follow the election in support for the change and a Republican victory and election to a majority in the Congress. They will continue the Bush the tax, which are scheduled to expire in January 2011. They won't allow it to end as it has been big business for them to stop it, so the most affluent can keep their money, which, in part, pays for the politicians to vote their way. The consequence of which will be that deficits will be out of control going forward as will the interest payments we will need to pay each year to pay for all our debt. It will be an irresponsible policy move. Of course these newly elected members of Congress will get us into a catastrophe much quicker with reactionary new policies, and this will drive us faster to the Great Depression, Version 2.0.

I think the Fed has done an amazing job managing our psychology these past 18 months along with the Government. I haven't liked it, as I keep seeing the man behind the curtain pulling the strings, as you do. But the facts of what we see everyday is hard to change by hype and manipulation alone. We need to see positive change in our community with better Home prices and Sales, less For Lease signs from Commercial Real Estate problems, less unemployed and more hiring and the business community taking a bit more of the risk and investing in new capital equipment. That is why the stock market has been in a tight range between 11,600 and 9800 during this period, with no significant breakout in either direction. It has been a tradable range of -15.5% to as high as 18.4%, but the timing has not been very easy to trade as most of those moves happen within a few days in each direction and by the time one reacts 50-75% of the move is over. That works fine for Wall Street with their program trading, but isn't so good for the average individual investor.

The battles in the future are going to be between the have's and the have nots. It has already begun if you haven't noticed these past few years. The Middle Class is being slowly extinguished. Eventually Unions will become stronger again but if we aren't careful as a country, we are going to resemble a country in Central or South America, where workers fight to try and live and governments eventually turn like Venezuela. The wealthy in this country are playing a very dangerous game that is going to come back and bite them badly.

One must ask them the most difficult question, which some amongst them have finally asked themselves. When is enough, really enough! How much wealth must one have and when is it counterproductive to the society one lives in to garner more just for the sake of having it. Bill Gates asked himself that question, as did Warren Buffet. I salute them both. But how many more, which I will not name, come to the same realization. You made as much as you have because of the America of the past, which had a vibrant Middle Class. It is equally important for them to have a strong Middle Class as well. It keeps peace in the streets and hope in people's hearts. We need more of that now.

The anger of those politicians who are riling up voters and has spawned the Tea party, is a prime example of what I mean. Being a politician and saying "No" all the time, does not create great solutions to problems, where all can live with a truly compromised solution. They are one sided solutions and half the population is going to be unhappy with the change. We need genuine compromises by elder Statesmen (and Stateswomen) if we are ever going to attack the deficit, Social Security, Medicare, the Military Industrial complex and ensure our national and individual security.

So that's what I see ahead of us. You can make a difference by not letting your anger get the best of your choices. Think rationally, not emotionally, what is truly best for the majority of people and choose accordingly. As to the stock market, don't let the swings between the ranges drive you crazy. Pick a strategy and stick with it until it is proven correct or false. As the charts of the Dow 6 month, 3 year and 30 year show below, there is a great battle brewing both short term and long term. This too will be the effect and affect on the economy and the stock market as it is impossible to discern which leads which and which follows.


OK, that was back on Sept. 4th. What about now. What inspired me to write this quite honestly is that right now feels like the same wall of price movement we had back in 2000 just prior to the Dot.com bubble bursting. I was warning people when the Nasdaq was at 4,800 to get out and go to cash. People pointed out at that time that the market was still going to go up and break through 5,000 and go up to 6,000. Well if you remember, we did break above 5,000 and went to 5,200 on the Nasdaq before the bubble finally burst. That was a long 11 years ago, but to this day we have not managed to gain back losses many still have to this day. Yes, I was wrong, people did wring out another 600 points or 12.5% gains from when I said to jump ship. Those wise enough to sell at exactly the top made another 12.5%. But those who didn't sell at the exact top are still down over 50% from that time and there is no telling how long, if ever, it will take for the Nasdaq to go back to 5,200. I say this all today because I thought the top of this market should have been 11,400 on the Dow and a comparable level for the S&P 500 and the Russell 2000. But because of market manipulation by the Fed, here we are at Dow 12,273, almost a full 1,000 points higher than the 11.400 top I had predicted. That works out to 8.8% higher than where I thought the top was. I was wrong, period!

But do you now think the market is going to go higher? Do you think we are headed to the market high of 14,000 for the Dow? Maybe you think we are now at the beginning of a new Bull market? Are you now going to venture into the market with fresh money and take a grab for that brass ring? Hear this and hear this clearly. The market is going to have a really bad fall in my view. It has been painful being short in this market as long as I have. But my firm belief is that this market is going to retest the 6,400 level on the Dow again and I don't believe this time it will hold that level. Is it worth the extra gains you might get from here or should you declare victory and sell some of your holdings and pocket the gains? You know what I think. If I'm wrong here you might eek out another 1,500 points on the Dow as the Bulls are declaring. That's a gain now of about 10%. If I'm right and the market does drop and retest 6,400, you will have lost 1/2 of your investment, just like the drop of the Dot.com Nasdaq bubble when it burst. For me, I think we have been in a Bear market rally the past year plus. You decide!

Here are charts below which I had posted in Oct. 2010 of where I saw the market top and I added a new horizontal red line on each to show you how much more we gained since my warnings.


Labels: , , , , , , ,

Tuesday, February 01, 2011

Are the new highs believable? You decide!

I have looked at the Dow 3 month chart tonight and what seems clear to me is that while we hit a new high today on the Dow and the S&P, when you look closely at the Volume today, you can see that Friday was the highest volume day. Yesterday's volume was higher than today's volume, which means that today's volume was the lowest of the past 3 days. It didn't convince me that we are now in a Bull market as some have claimed today. Take a look yourself at the chart below and you decide!

Today I purchased more TZA shares for $14.27/share. I know, you think I'm crazy. :)

Labels: , , ,

Thursday, January 20, 2011

Market comments for Jan. 20th

I was asked by a close friend of mine why I didn't post about the market this morning. I said to him because nothing is any different in the market from my comments on Monday. The Put to Call ratio signaled a Sell signal on Jan 14th and I said that it may take a day or two or as much as a week, but the Dow has dropped a minimum of about 800 points when the readings of the Put to Call ratio was that low. In the charts below I have a 3 month chart of the Russell 2000, symbol RUT, and the S&P500, the nasdaq and the Dow. You will notice I have placed the charts in an order in terms of which has broken below their 9 day MA as well as the 18 day MA. So they are arranged from the order of most correction so far. Expect all the Indexes to correct and go below their 9 day and 18 day MA.


Today the Put to call ratio intraday had a high of 0.98 and a low of 0.81 and closed at 0.93 for the day.

Labels: , , , , ,

Monday, January 17, 2011

The Put to Call Ratio warns again. Are you listening this time?

It should be a quiet day today as the Banks and Stock Markets are closed here in the U.S. for observance of Martin Luther King Day. For those missing market action I decided to recap where we are and what data, if any, was noteworthy from Friday. Well, I found one small piece. It was the Put to Call ratio at the close on Friday. It came in at a 0.57 reading. I thought you would need a context for that reading and so I have included 3 charts below. The first is the Put to Call ratio from Oct. of 2003 to the close on Friday.

As you can see from the above chart, a reading of 0.57 is on the rare side and falls outside the normal range of data with a 95% confidence level. I have identified various dates when a reading this low or lower occurred. Why is this reading important? Well, it is because often it is a sell signal for stocks. I said here, often, not always. The other two charts below are of the Dow. The same dates have been identified on those two charts. The first chart is the Dow plotted linearly and the second chart is the same data plotted on Log scale. Log scale shows a more dramatic change than a linear scale does. Here are those 2 charts.


I think it is quite clear that in all cases in subsequent days following the readings the markets dropped. Some times, like Mar. 16, 2006, it was a small drop of about 800 points and other times it was the massive selloff we experienced where the Dow dropped almost 8,000 points.

We may still rise a few days or a couple of weeks, but we are in store for another correction of at least that 800 points but we could also be at that tipping point of thousands of points again. According to Elliott Wave Theory, we are in for a doozie of a correction all the way to the depths of hell by the time it is complete. These things don't happen in a matter of days months or year. It can take years to unfold but one thing is for sure, when they do come they bring sizable pain. I am not expecting the same levels of depth as does Elliott wave Theory prognosticators, but I do see a drop of at least 5,000 points for the Dow coming and a retest of 6,400 low registered in 2009, which I believe will fail as well in the end. Even the Fed won't be able to stop it when it starts. Not only won't Bernanke be able to stop it but all the Kings horses and all the Kings men won't be able to put Humpty Dumpty back together again!

The real important question to ask yourself is this. What if what I am saying does happen? What actions will you take? Will you start to buy on the dips as the market starts dropping and be buying too prematurely, only to see you selling the stocks you bought and repurchasing them again a bit lower? Or will you just Hold on to your stocks in hopes of a quick turnaround? Or will you be like a Deer in your headlights and be frozen into no action at all? These questions are worth asking yourself. You see they can be grouped in categories like these: Reactive, Responsive and Proactive. Which strategy will be best for you and what does that actually mean? As I learned as a Boy Scout: Be Prepared!

Now for a little light humor. You might call this post today in honor of Dr. Martin Luther King: I have had a Bad Dream!

Labels: , , , , , , , , , , ,

Monday, January 10, 2011

Market comments for Jan. 10th

This morning, the Dow broke below its recent uptrend line which has been in effect since the beginning of December. If the market volume is stronger than Friday's, it would be a confirming sign that the uptrend line has begun its long anticipated trend reversal, as you can see from the chart below. It is going to be interesting times!

Labels: , , , , , ,

Sunday, January 02, 2011

Summary of yearend 2010 and looking at 2011 in the stock market indexes

One thing from 2010 to report on the last day of Trading. In the first 1/2 hour to 1 1/2 hour, the Put to Call ratio was extreme at 1.33 to 1.37 as reposted by the CBOE. That was actually a buy signal in the morning and that followed through as the Put to Call ratio closed at about 0.99 for 2010 in the final minutes. The last time it was that high was Nov. 29th. The Dow closed at 11,557 for 2010, the S&P500 closed at 1257, while the Nasdaq Comp. closed at 2652. Watch the markets rise again in the morning.

The 52 week high for the Dow was 11,625.
The 52 week for the S&P 500 was 1262.
and the 52 week high of the Nasdaq was 2675.

As you can see from the 52 week highs, we closed near the highs on all 3 Indexes. The best way to see where the market is headed is to keep track of the 9 day Moving averages. For example, as you can see from the chart below, the Dow & S&P 500 have managed to stay above the 9 day MA for the entire month of Dec. Any cracks in trend will show up here first. The Nasdaq was the only index during December, of the 3 Indexes, to go below the 9 day MA and that happened only on Friday. The markets will keep breaking below more Moving Averages if we are headed down. But if we break below them and manage to rise back above in a day or two, we won't be going down yet.


Let the Games begin for 2011. Good luck to all.

Labels: , , , , , , , , , ,

Saturday, November 27, 2010

Market comments for the week of Nov. 29th

Good day everyone. Hoping you are resting and catching your breath this longest of holiday weekends. You all work hard and once in a while you get a chance to rest so I hope you are taking it and resting as hard as you work.

Today I have 3 charts I am posting below. All 3 charts cover the past 3 months and all have 25 and 50 day Moving Average lines on them. You will notice that both the Dow and S&P500 are in a tight range between the 25 and 50 day Moving Average lines. The 3rd chart is of the Russell 2000 and it has a noticeably different chart pattern. It has remained above both the 25 and 50 day Moving Average recently. I believe that this Index is in an overbought condition and should have a larger drop when the breakout occurs to the downside. The Russell 2000 Candlestick pattern was a Hammer on Friday. So we shall see if this reverses the uptrend.


I have received many questions as to whether TZA will ever recover from the losses piled up on this Ultra Short ETF. That's a great question, but like all market moves, I can't tell you. All I can say is that I firmly believe we are eventually going to have a major market correction and retest the lows on the Dow of 6440, and when that happens many are going to be very scared. Whether the trigger is a Sovereign debt issue in the Euro zone or an economic trigger here as many believe QE2 from the Fed is killing us by death of 1000 cuts at a time.

In the meantime, live life the best you can to its fullest, as life is short. Spend quality time with family and tell them you love them. And as the Christmas holiday approaches, do something for the least of us, as you will feel good when you do. Whatever you have it's more than many in this world.

Labels: , , , , , , , , ,

Saturday, November 20, 2010

Another new low on Put to Call ratio

Yesterday's market close for the week showed another new low for the Put to Call ratio. It closed on Friday at 0.66 and the week before it closed at 0.69. This is yet another sell signal that we are going lower. The question you might be asking yourself is why did the market have a good day on Thursday? Simple answer, 2 factors, both related. The first factor was the GM new IPO offering, which was a good thing if you want the government out of the car business. With the IPO, the government can get the money back they invested to save the auto industry and jobs. THe saving of jobs worked and it looks like GM has a better footing to do both.


Now the second factor, which I said was related was this, the market was manipulated by the Fed to stay up, so the IPO would be seen as successful. The Fed did say it's monetary easing (manipulation of the stock market as just one manifestation of the use of that word) was working this week when Bernanke spoke abroad. With prices propped up, it was a great climate for the IPO that day. But on Friday, the market reached a more bullish extreme as puts had been dumped on Thursday and Friday causing the Put to Call ratio to go even lower than last Friday, Nov. 5th.

We may be setting up a pattern of increasingly lower lows on the Put to Call ratio, which in turn will set up larger sell-offs and possibly this is how we have have the really big one. When that happens we should see this ratio drop as low as 0.5 or lower.

Below is a 1 month chart of the Dow. As I said on Nov. 5th, the Put to Call ratio signaled the reversal in trend. Compare where we are now, with an even lower Put to Call ratio yesterday. We did not go over the 25 day Moving Average line in yellow. So I see another leg down within the next week and a half. I say a week and a half because we have a short week because of Thanksgiving. So it will take the following week for the market to drop below 11,000 on the Dow and stay there. Watch the hype about what a great shopping day the day after Thanksgiving was for Retail Sales. It will be all lies!

There won't be much to post next week and you may be traveling, so let me wish one and all a very Happy Thanksgiving. My wife and I will be local and enjoying a Turkey dinner with my friend and neighbor, his children.

Labels: , , , , , ,

Saturday, October 30, 2010

Market comments for the week

I did not write much this week and you might be wondering why. Some thought because the market hasn't gone down that I didn't want to post but they would have been wrong with that assumption. The real reason was that there wasn't any real news or market change to post. A week ago on Oct. 22nd, the Dow closed at 11,132 and the S&P500 closed at 1183. Yesterday, the Dow closed at 11,118 and the S&P500 closed at 1183 again. You see you could have been on vacation and not missed a thing.

Let's take a look at the charts of the Dow and S&P500 below. You will see clearly we went nowhere and it appears one of two things are happening. The Bull's story goes something like this: We are building a firm base here to go higher after the election. The Bear's story on the other hand goes like this: We are hitting strong resistance at these levels and are unable to break above them. But after the election when it is obvious as to the results, the market will drop on the news (Buy on the rumor and Sell on the news). You can see the horizontal resistance lines in both charts. To me the 200 day averages will be key going forward if there is any correction. If we break below them, the markets will have a meaningful correction. Without a break below that level, the market manipulators are still smoking something because this rally is not warranted in this economy.


I am in the camp of selling on the news and I'll tell you why. This election cycle is no mystery. The Democrats will lose the House but it won't be a complete wipeout of 100 seats, but more like 55, and the Senate will remain in Democratic hands with a slim majority. All the surveys point to this outcome, so the bets have been made and the wager will be collected after it is official on Wednesday. So, no real news yet to move the market this past week. Next week will be a different story as market direction may be more clear. Personally I have been waiting for a major correction so long now I am almost getting tired of saying it. This has been a long extensive run up in the Bear market rally.

Labels: , , , , , , ,

Saturday, October 16, 2010

The war between Fundamental Analysis and Technical Analysis is being played out in the stock market. What is it telling us now?

I have been thinking about this post for a while. It was triggered by friends who see the stock market in diametrically opposed positions. It appears to look like a Bull versus Bear argument but it's really not. It is the difference between those who use Fundamental Analysis and those who use Technical analysis to make decisions about market direction and trading decisions and whether to Buy, Hold or Sell. In order to get at this problem, I must first explain the difference between both analysis techniques. For that I will use the 4th Edition book by Martin Pring titled, Technical Analysis Explained. It is considered the bible for those interested in Technical Analysis. I will not make this too lengthly, but it is important to lay this foundation before I get into where the market is going to go and why the opposing positions have the positions they do. I will conclude with a number of charts and some support for the idea that while the disparity will continue between these two positions, one position is going to lead the way into the future as it is doing right now behind the scenes.

Ok, here we go. "Technical Analysis in nothing more than a tool", says Martin Pring. But a very good tool I might add. "Technical Analysis is based on the assumption that people will continue to make the same mistakes they have made in the past." According to Investopedia.com, "At the most basic level, a technical analyst approaches a security from the charts, while a fundamental analyst starts with the financial statements. By looking at the balance sheet, cash flow statement and income statement, a fundamental analyst tries to determine a company's value. In financial terms, an analyst attempts to measure a company's intrinsic value. If the price of a stock trades below its intrinsic value, it's a good investment.

Technical traders, on the other hand, believe there is no reason to analyze a company's fundamentals because these are all accounted for in the stock's price. Technicians believe that all the information they need about a stock can be found in its charts.

So currently the argument, for those using Fundamental Analysis, goes something like this. The S&P 500, based on historic terms is trading at about 21 times trailing price-earnings ratio and therefore is cheap as an investment today. That compares to the historical average of 16.4 since 1881 and is at the top end of the range pre-2000. The S&P 500 is expensive on a long-term basis, but and this is the big but, inexpensive compared to the past ten years. (Source: Prieur du Plessis)

Technical Analysts say, "Look at the charts! We are ready to drop significantly!" What do they base that argument on? A Head and Shoulder chart pattern. Let's take a look at several charts and explanations of the Head and Should pattern from several sources. The first chart shows a Head and Shoulder pattern looking at Oil prices back in time with an explanation on how to read the chart information.

This second chart shows a classic head and Shoulder pattern on a usual uptrend similar to the latest market movement this past few years.

This 3rd chart depicts more closely, the current market trend of the past 20 or so years and how to determine how far it should drop, and shows the neckline to measure the amount of the expected drop.

And the last 2 charts show the Dow and S&P 500 for the past 30 years and the big Head and Shoulder pattern we are starring at as Technical Analysts. It explains why many from this camp are very worried about the future.


One other very important relevant piece of information, High Frequency Trading now controls about 70% of the market volume traded in a single day (Source, 60 Minutes broadcast of Oct. 10th). It has also been determined by the SEC, that the single one day crash on May 6th where the market dropped over 600 points in 15 minutes was caused by the High Frequency trades made. It was caused by an algorithm (a set of rules to be followed in calculations and problem solving by a computer). Since May 6th, the SEC has instituted trading curbs, which stop the trading in any security which drops 10% in a short amount of time. Since the trading curbs have been in place a number of times the market has had to be stopped because of similar algorithms by other firms had glitches. The market is not being run by the individual investor, it is being run right now by computers, which were set up by humans, who tend to repeat the same mistakes, as I stated in the beginning of this piece. This is why I like Technical Analysis. You know we humans are going to panic at some point in the very near future. What will be the trigger is anyone's guess. But I think any rational person would agree we are going to panic and we are all just waiting like deer frozen in the headlights.

It has been painful staying on the short side of this market recently, but it will pass. I wish it weren't so, but I am worried many are going to feel some really bad pain and they are going to say it was unforeseen. The Fed will be the first to use that excuse when it happens. Just watch!

Labels: , , , , , , , , ,

Technorati Profile