Tuesday, January 17, 2012

January 17, 2012 Dow analysis

I have been asked where do I stand since my last post, since I hadn't written anything for 10 days here. Well, the reason I haven't posted was because nothing has really changed for me to comment on. So what I have done is to put a 1 year chart up of the Dow and you can see we still have not broken above this line to have a breakout. We get closer but no real conviction. Here's the chart below:

If and when we do have a clearer picture of where we might be headed I will post something to that effect. But we could be in this never land for a while as Europe tries to straighten itself out from their Sovereign debt crisis. Greece is on the brink of succumbing to default any time now.

Labels: , , , , , , ,

Sunday, January 08, 2012

Where is the Dow heading?

Today we look at the Dow over a period of 2 to 5 years to get a sense where we are and what we must consider as we try and manage our investments. We are at a critical point where we are either going to have a breakout to the upside or we will have a breakdown to the down side as illustrated in the charts below. First let's look at the 2 year chart for looking at the current top of resistance. It is that highest blue horizontal line.
In the chart above, the bottom red line marks a short term support line. Breaking below this line doesn't mean we have a significant breakdown, but it does mean we need to be careful. In the 5 year chart below, you will see where the next real support line is and this one we must stay above or we may go down and retest the lows again.

Much going on this week in Europe and while we begin Earnings season with Alcoa reporting its earnings, Europe may take center stage over any news here.

Labels: , , , , , ,

Monday, December 26, 2011

Year end summary of the Dow and stock market trends

This is my year end summary of the stock markets for the year and where I think what might occur in 2012. My first chart below is of thew Dow for the past 10 years on a monthly basis. As you can see below, for 2011 the Dow managed to stay between 11,000 and 12,800. Looking at the big drop in 2009, where we went all the way down to 7,000 on a monthly basis and 6440 as a low daily close.

It is interesting to notice the Volume chart for the Dow. We averaged about 600 Billion shares a month from 2002 to mid 2009. Since then we have had a significant drop to 380 Billion shares. So the rise from 7,000 was built on significantly less volume than the rise from 2002 to 2009, which was a Bull market rally. It looks to me that since 2009 we have been in a Bear Market rally, as the volume has been too low for a true Bull rally.

The key to watch on this Dow chart are the 2 red lines. We will need a breakout either to the upside or to the downside to determine longer term trends from this chart alone. However, looking at the Dow 25 year monthly chart, we get more clarity, as seen below.

I do still expect a drop below current levels during 2012. The Head and Shoulder patters or "W" pattern as I call it does point to lower lows going forward and limited upside potential.

Given the chart readings, the next thing to do is see if world events suggest a more optimistic or pessimistic view for 2012. We have a Presidential year election in November 2012 and we have had gridlock in the Congress in 2011. I don't see the gridlock easing and many issues including our own debt which must be dealt with as well as continually funding the government. The Unemployment scene isn't going to get much better because we have structural unemployment which will be around for a long time unless somehow we retrain workers in new skills to meet a more technological demand than typical blue collar workers have brought to the work environment. We also have the Supreme Court making a decision on President Obama's Health care bill legislation as to whether it is Constitutional or not.

Then we have the Sovereign Debt issues in Europe, the Arab Spring and new leadership in North Korea, a test of the government of Iraq to function without our military presence and then there is Iran's pursuit of Nuclear weapons. The Euro is in crisis and Russians are challenging Putin's grasp of the presidency there. And last but not least, we have all those who believe the world will end on Dec 21st 2012 because of the Mayan predictions.

Let's conclude with the fact that 2012 will have many volatility swings ands most likely testing the previous extremes of those swings. It is a year to be cautious with your financial assets. My belief is that we humans will do almost anything to avoid pain rather than to risk succeeding. Therefore, I believe it is wiser to be on that side of the investment strategy by being short from time to time. It is also wise to take profits sooner rather than being greedy and waiting for more profit before selling.

Good luck this coming year. Thanks for taking the time to visit my Blog. This new year marks 7 years of my blogging. I have had 79,000 visitors to my site in that period. Happy New Year!

Labels: , , , , , , , , ,

Saturday, December 17, 2011

Market comments for the coming week of Christmas

Oh I hate to be so repetitive. As I said in my last post on Dec. 5th, "I thought it was time to post on the stock market again." The main points to make this week are that all Indexes are now below their 200 day Moving average line, shown faintly with the yellow lines on each chart below. My opinion continues that this shows the tendency is still to remain below the 200 day Moving Averages in the intermediate timeframe. While there was "hope" the Eurozone had "solved" its crisis we all know better now, don't we. Unfortunately it will take a stock market crash or a sovereign debt meltdown causing a market crash before Europe is forced to come to terms with its problems. Here are the updated charts of our major indexes.


Labels: , , , , , , , ,

Sunday, December 04, 2011

Market comments for the coming week of Dec. 5th.

I thought it was time to post on the stock market again. The main points to make this week are that all Indexes, except the Dow, are still below their 200 day Moving average line, shown faintly with the yellow lines on each chart below. The second point is that while the Dow remains above the downward sloping red line, the Russell has remained below it the most. The Dow is most likely the most manipulated Index and the Russell the least. My opinion is that this shows the tendency is still to remain below these red lines in the intermediate timeframe.


This week will have its important announcements. The biggest news item will be the European meeting, scheduled on Dec. 8th and 9th, of Finance ministers to discuss resolving the Sovereign debt issues of Greece, Italy, Spain, Portugal and others. This will be the most important meeting of the last year as it is the first since the coordinated Central Bank intervention to lower the rates banks pay to increase reserves. The Central Banks took this action because there was an immediate concern of a large bank failure in Europe. Our markets will react to what happens there, not here.

Labels: , , , , , , , , ,

Saturday, November 12, 2011

Stock market: Where are we going?

I thought it would be worthwhile to look at this past week and see where we ended up. In my last Blog post, I cited the fact that the 200 day Moving averages appeared to be a significant resistance level for all major indexes. This week proved that point again as we ended the week with only the Dow above the 200 day MA. The S&P 500, the Nasdaq and the Russell 2000 all are still below their 200 day Moving averages. Until we can climb above these indexes we are stuck from going higher.

The Put to call ratio closed the week at 0.93, not exactly a buy signal. The sovereign debt issues in Greece and in Italy took center stage in the early part of the week. Then the resignation of Greece's Prime Minister and the signal that Berlusconi of Italy may resign next. ALL THESE MOVES CLOUD THE FACT THAT THE DEBT ISSUES AND AUSTERITY MEASURES NEEDED TO RESOLVE THEM HAVE YET TO BE IMPLEMENTED. Stay tuned as the volatility will continue for the next 6 months. Even if austerity measures are passed by the governments, the people will be heard on these matters in ways that will frighten many. The people have only begun to make their objections known to the world and their leaders. In true democracies, leaders can be voted out or feel enough pressure to resign. This crisis is just in its infancy.

Don't forget that there are now only 11 days left before our Super Committee must agree to cuts in spending or automatic cuts in the military will be implemented. My guess is they won't do what's necessary and the US will be downgraded again by the S&P and Moody's rating agencies.

Here are the charts promised earlier:


Labels: , , , , , , , , , , , , , ,

Wednesday, November 09, 2011

Market comments for Nov. 9th, 2011

Sorry I haven't posted recently, I was away back east to see my Mom and when I returned I had caught a very bad cold. But I'm back now and let's get at it.

I have watched the rise of the Dow recently as well as the other indexes over the 200 day Moving averages. But todays drop of between 200 and 300 points this morning, shows the strength of the 200 day MA line as a resistance level. The market actions have not made sense given the news in Europe and the fact that our own government may get downgraded as well for a second time. Greece has not really solved its problem but they did replace their leader. Italy may replace its leader as well, but replacing the leader doesn't solve this crisis in either countries and more than it would here. The problems are similar and the pain will have an impact and it is human to avoid pain. So my guess is that these problems will unfold stubbornly over time. The only solution I can see is a breakup of the EU in some fashion. Either the countries of the south like Greece and Italy will not be part of the EU anymore and possibly Portugal, or the entire EU will eventually dissolve.

Below are the charts for the Dow, S&P 500, the Nasdaq and the Russell 2000 with their 200 day Moving Average lines. Unless the market can stay above these levels we are headed lower. Needless to say, it may be true again that the last rally we had was a bear trap. More on that over the weekend.


Labels: , , , , , , , , , ,

Thursday, October 27, 2011

Markets rally strongly. What's next?

Markets rallied strongly on the Euro zone deal to solve the debt crisis in Greece. It's just a fact. The Dow surged to close at 12,208, the S&P rallied to close at 1284, the Nasdaq to 2738 and finally the Russell rallied to 765. All of these Indexes, except the Russell, surged above their 200 day Moving Averages. They all made a significant breakout, which can't be denied. And they did it on stronger volume, always a good sign for Bulls. This surge makes it possible for the averages to go back to the previous recent highs. For the Dow, that would be about 12,800. For the S&P 500 that would be 1360. For the Nasdaq that would be 2870. And for the Russell it would be first getting over the 200 day MA at 790, but then going on to 860. All this now becomes possible again. As I said, it's just the facts.

We had good economic news coincidently with this market move. GDP for Q3 came in at 2.5%, healthier than some low predictions of 1.5%, but not as strong as the highest ones which were at 3.5%. Initial Jobless claims were still over 400K this week coming in at

Can the markets reverse where they are now and go down? Yes, but if they do one might consider buying on the dips. Remember when we did that long ago? I do.

I have said to watch Europe and the DAX for clues about this market as we have been following Europe. Well the DAX and France's CAC as well as other european markets also surged today.

I have placed 1 year charts of all the Indexes below.


Labels: , , , , , , ,

Saturday, October 22, 2011

Stock market analysis and commentary Oct. 22, 2011

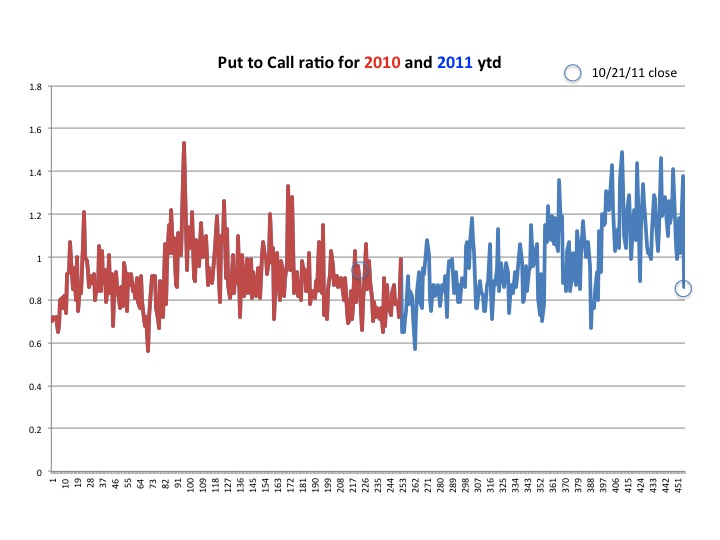
The stock market had a surge yesterday on high volume and the Dow closed at a 11,808, bringing it near a 3 month high. Of course this was done on Options Expiration day. That explains the high volume, but not the surge up on the Dow. Yesterday also had one of the lower Put to Call ratio readings as seen in the chart below. Be sure to read my last post where I said to watch this ratio to go below 1.0 and head to a 0.7 reading.

What has dominated our stock market action has been Europe and the Greek debt crisis and impending crisis in Italy and Spain. there were some hopeful comments made that the meeting this weekend of the G-20 would yield some good results. Greece's Parliament did pass more austerity measures in the face of Union strikes and violence, all giving many hope that Eurozone countries will get past this problem and on solid footing. But Germany's Merkel has said to the effect, not to count much getting done at this meeting this weekend as it will take many more meetings and months or longer to solve these crisis. It didn't matter to the market traders as they jumped on the bandwagon of "hope" and drove stocks higher as the Shorts took it in their shorts with big hits in their portfolios.

The Dow trend has clearly broken above a tight range and it could have legs to go higher. I can envision a move to 12,000 is possible, but the risks to go back below 11,000 is also as strong. The 200 day moving average is at a few points below 12,000 but the line is sloping down so I don't see us going up above this level. See the 6 month chart of the Dow with the 200 day MA below:

Much will be dependent on the news from Europe. Many think that our earnings announcements will drive the market higher, but the fact is that many companies are missing their targets like Apple, The Blackstone Group, Schlumberger, Travelers Ins., Morgan Stanley ( missed w/o accounting move) and a number of other prominent companies. Remember most targets had been lowered because of the economy so even beating them is nothing really impressive with this very slow growth economy.

The best moves have been to play the wide swings in the markets due to high volatility. But this is not for amateurs. And I consider myself a amateur, as most are because we don't have the ability to execute High Frequency trade in nanoseconds like the big boys do, so we are always too early or too late for a trade to make comparable profits.

Labels: , , , , , ,

Wednesday, October 12, 2011

Market comments for Oct. 12th, 2011, Columbus day

Say what you like about this rally, it has surprised everyone, including me. I had to look at the chart this morning to see just how high it has climbed back up from the bottom and to see whether I think it will hold. The chart below shows it was a rise of about 8% in 7 trading days. However, when I look at the very low and dropping volume, I am very suspicious of this rally and it appears to me to be a another bear trap. Here's the chart. You decide!

Labels: , , , , , ,

Monday, October 03, 2011

Market commentary for Oct. 4th, 2011

Tuesday's charts are of a longer period than previous charts for a while. I have put together charts of the Dow, S&P and Russell 2000 each for 3 year periods. I have drawn a number of red lines showing where support is and where you can see we may be headed. First the charts and then some commentary:


The Dow broke below recent previous lows and while it barely is below those lows, the trend looks like we are going lower. The bottom of the Dow's range is 10,000, which is 655 points lower from where it closed today. We could just as easily climb above today's lows, but we should be going lower, as the news in Europe has not solved the Greek Debt crisis and Greece today said they did not reach their goals around there promised austerity targets they had committed to the EU. That was a major reason the markets ignored good news today regarding the ISM number which came in at a 51.6 reading against an expectation of only 50.0.

The S&P500 shows a larger drop against the previous lows and the Russell 2000 shows an even greater drop. By the way, Germany's DAX Index is also going lower as is the CAC40 and FTSE, but I didn't put up those charts today. News isn't mattering these days. Lowering ones risk is what is driving the world markets now!

Labels: , , , , , , , , , , ,

Saturday, October 01, 2011

Stock market direction? Nothing has really changed!

Since the beginning of August, when the stock market had its big drop based upon the announcement of the Fed that they were going to keep Interest rates low until 2013, nothing much has really changed. We have been in a tight range that does't feel so tight because of the high volatility. One week we are just below 11,000, wondering if we are going to hold support here or go lower and the next we are back up to 11,500 wondering if we can break much above this apparent resistance level. It has been worrisome for most investors but not for day traders. The best day traders are making some money, but the rest of us watch in disbelief.

I have compiled some 1 year charts below to reiterate and reenforce previous posts where I said we are in a tight range but now we are closer to a breakout, one direction or another. I have stated many times I believe this direction is lower, so no sense repeating much more than that.

This week Germany's Lower House of Parliament approved increasing the proposed EFSF (European Financial Stability Facility) expanding the euro-area rescue fund's fire power to stem the region's debt crisis. To read more about this Fund and the politics in Germany over this issue, click here. This seemed to move their stock market higher but as the week progressed you can see in the charts below, it pulled back.


You can see I have drawn red lines showing support levels and Blue lines showing resistance levels. You will also note that since the drop in August we have stayed below the 50 day moving average consistently. This line might be a good indicator to track market direction so that you are not fooled as we many during the Bear Trap so noted on a number of charts by the blue circle covering their mistaken purchases. Use these charts as a reminder of where we are and above all remember the Fed doesn't think we are going to get better until at least 2013!

This coming week on Friday, we will get the Unemployment rate for September. This could move markets. Also on Monday be watching for the ISM Index at 10:am EST or 7:00am PST. Expectations are for a reading of 50.5 and the previous month the number was 50.6. I expect the number to come in at 50.0 or less, given the lack of business activity there was in September. Earnings also will be front and center now for the next 4 weeks. You will be hearing about "beating expectations" by companies. Remember, these predictions were lowered last time so that beating these expectations should not be difficult.

Labels: , , , , , , , , , ,

Friday, September 23, 2011

Market comments for Sept. 23, 2011: Another down day

The stock market is going to open in 1/2 hour. The Dow Futures are down another 110 points pointing to a lower open. As a reminder of where we are now, I have included 2 charts today. One is of the Dow and the other is for Germany's DAX index. I have placed an "X" on the Dax chart to where the market is currently as its market is open. The DAX is very close to the 5000 level. The German DAX is trending clearly down from the red lines I have drawn. Our Dow chart matched the recent low and I fully expect all our Indexes will go lower. We are in the second inning of a 9 inning game and more is to come to the downside. As I have stated before, this drop will not be straight down as there will be days up. So it will look more like a zig-zag pattern. I am pretty confident the market will close down today because no one wants to buy stocks today going into an uncertain weekend. Also, yesterday's volume was heavy at 300 Million traded on the Dow.


Here are the charts:

Labels: , , , ,

Tuesday, September 20, 2011

Market comments for Sept. 20, 2011

Today I have a series of 3 charts to show you, but before I do a little explanation and commentary. Over the past several months now our US market has been in a relatively tight range of between 11,500 and 11,000. It has been a stated fact by many analysts that the US market is following the European markets due to the concern of a default of Greece. Even as recently as this past weekend, there was news that the governments bailing out Greece wanted to extract some guarantees that Greece was serious and they wanted to see Greece promise to layoff about 100,000 government workers. So that is the backdrop story.

I have put together a chart of Germany's DAX Index, France's CAC 40 Index and the Dow. All are 1 year in duration as of the close yesterday. First the charts and then the commentary.


As you can see from the charts above, Germany and France's Indexes are still apparently going lower and the Dow and other US Indexes seem to be not following the most recent trend as show by my red lines. To me I interpret this to mean that 2 scenarios are possible, First and to me the most likely scenario is that any more of a drop by these European markets may result in a sharper drop by the Dow. The other scenario is that we will disconnect from these European markets and stay within our tight range until our own economic results determine our separate direction. Much depends right now on the politics of the negotiations by Congress over the next few months and to whether the joint committee will be able to agree on spending cuts and revenue increases. However, be forewarned that Europe is really driving our markets and we could be setting up an alarming drop as many are not prepared for the market to go lower. I was at a party on Sunday afternoon where someone who was talking about the market stated that all indicators he has been watching have flashed a Bull market rally is about to begin. I told him I didn't know what he was watching but I think we are firmly in a Bear market and we are going much lower.

Labels: , , , , , , , , , ,

Sunday, September 11, 2011

Remembering 9/11, then and now at the stock market.

As we stop and pause and consider the events of 9/11, on this 10th anniversary, there isn't much I can say as I find myself as speechless as I was on that day, having watched it live on TV that morning. The world stops and remembers those who lost their lives, but the world does moves on, thank God.

I remembered the aftermath and the fact the stock market was closed for about a week and when it opened we took a big hit. The Dow had been as high then as 11,500, but it dropped sharply and over days and weeks went as low as 7,000.

This morning I have put together a 2 year chart of the Dow which will show the the tightening range we have been within the past month. The red lines on the chart below show this range tightening. The triangle is pointing to a further downward trend. The top red line shows that we had a trend headed down and that even though we broke to the upside, we resumed this trend over the past month as the red line was drawn to touch those peaks.

Where are we headed? Well I have drawn the blue arrow indicating where I think it's going and that is down. Could we go down as low as Dow 7,000 ? Yes and unfortunately we can go lower. Not a positive picture of things to come, but the world has changed since 9/11 and it's not been for the better.


The chart below covers June1, 2001 through Dec. 31, 2001 and shows the decline of the markets in the aftermath of 9/11.

Labels: , , ,

Saturday, September 10, 2011

Stock market summary and look ahead.

As predicted in yesterday's post, the markets sold off. The Dow closed down 303 points to 10,992, again breaking below the 11,000 level. Looking at the 3 month chart of the Dow, it has been easier for the Dow to go below 11,000 than it has to go over 11,500. The pressure is to the down side. And all the news is to the downside as well. You can see from the chart below that the blue line of the 400 day MA is proving to be resistance as well.

A big test for the Dow is soon coming. The 52 week low is at 10,458 and this will be tested and new lows will be set, in my opinion.

I was at a Berkeley Art Gallery (ACCI) opening show for some of my wife's art and her friends last night. It was a good show. One of the artist husbands and I were discussing the big drop in the market yesterday and he suggested that the drop was because of President Obama's speech. I suggested that this was not the reason for the drop and that it was the European Central Bank's Chief Economist quitting over disagreement with the purchasing of Eurobonds by the ECB. (read yesterday's post). European turmoil will continue to lead our markets direction and I fully expect it to get worse with all markets eventually returning to test the lows of 2009. This level corresponds to 6,400 on the Dow, 675 on the S&P 500 and 1300 on the Nasdaq.

Caution is the word going forward. If you are in cash, you have no worries about the market. If you are long this market I would be protecting my assets by either selling some stocks and taking some money out of the market, or I would hedge my longs with some shorts or even buying some ETF's which go in the opposite direction of their underlying stock Index. This is no time to be taking big risks. The Put to Call ratio has been over 1.00 for the past 29 out of 31 trading days. That is extraordinary!

Labels: , , , , , , ,

Monday, September 05, 2011

Germany in the news: Market drops over 5% (UPDATES)

Big news in Europe starts off this post this Labor Day. German Chancellor Angela Merkel’s party lost weekend elections in her home state, stoking concern opposition is growing to bailouts for debt-saddled European nations. This in turn has caused the German DAX Index to tumble over 5% with only a few hours to go in trading. I will update this post after their market closes. But I do have a chart of the DAX Index for the past few years and you will clearly see that they have broken below the current lows and the implication is that our stock market will follow suit tomorrow. This would accelerate the drop and almost assure a drop below 11,000 again. Here's the chart of the DAX Index:

You can see that todays last data point is lower than the previous recent lows, implying a drop below the red line. Looking back over the years you can see this is an important level not to go below. Their lows correspond to our low of the timeframe when the Dow went to 6,400.

Again I repeat, this week is very important not just here in the US, but also in Germany as on Wednesday there is a vote as to whether they will support the bailout of the debtor nations in Europe like Greece and Italy and Spain. Then add to that news, we have the President's Jobs speech on Thursday and the markets will have a reaction to these events. Stay tuned!

UPDATE: 8:45am PST
From Reuters: "Italian economic growth is likely to fall short of the government's official forecast of 1.1 percent in 2011 and 1.3 percent in 2012, probably coming in under 1 percent, a senior government source said on Monday. "It will be very difficult for Italy to reach 1.1 percent growth this year and next," the official, who spoke on condition of anonymity, told Reuters."

Italy's stock benchmark FTSE MIB Index was down 4 percent, with UniCredit SpA (UCG) and Intesa Sanpaolo SpA (ISP), Italy’s biggest banks, dropping 5.8 and 6.2 percent, respectively. Markets are getting very rattled in Europe.

Another Update will be given when the German market and European markets close.

UPDATE: 11:05am PST
Germany's DAX Index closed at 5,246 today, down 5.3% at the close. Following Germany's lead were other European Indexes such as France's CAC Index, down 4.7%, Britain's FTSE Index down 3.6% and Italy's FTSE MIB Index which was down 4.8%. This should send ripples in Asian markets tonight and our US markets tomorrow.

Labels: , , , , , , , , , ,

Saturday, September 03, 2011

Market comments for the week ahead: Germany in focus

The market ended the week down. Many did not want to go into the weekend holding stocks, because any news in Europe can quickly devastate stocks here. So caution is the rule, especially in September and October, the 2 most volatile months for the stock market. This morning's charts have a new discovery for me. I have the usual 200 day Moving Average lines drawn on the chart but also have included a 400 day Moving Average line, as well. As you can see from the 4 major Indexes below, it looks like the 400 day MA is the resistance line for the market and can give someone a better gauge as to whether to believe market moves or not. The last move up proves now to be a false Bear trap as anyone now knows after buying stocks when they appeared to be breaking above the downtrend line drawn in previous posts of a week ago. Here are today's charts.


This last chart below clearly shows that the last move up was a Bear trap for those unsuspecting traders. They would be wise to stay on the sidelines and watch rather than lose their money. This zig zag pattern downtrend will continue as there is no good news coming in the world as it pertains to their economies and this coming Wednesday all eyes will be not on the Republican debate but on Germany's vote as to whether they will be bailing out other countries. Watch this news as it will move our markets more than any other news.

Germany's Merkel is vulnerable to losing control. This analysis from Berlin:
"Merkel's coalition has a comfortable 20-seat majority in the lower house of parliament. But if she is hit with dissent in her own ranks, and is forced to rely on opposition parties to pass legislation to expand the single currency bloc's rescue mechanism -- the European Financial Stability Facility (EFSF) -- then her coalition could collapse, sparking early elections.

'The euro crisis entered a new phase over the past week,' influential German weekly Der Spiegel said on Sunday.

'Before the main question had been how the common currency could be saved. Now it is also about saving Merkel's chancellorship. If her coalition does not deliver a majority for the enhanced euro rescue mechanism in the autumn, people close to the chancellor say, the coalition is all but finished."


So this is what to watch on Wednesday. Good luck in the market next week and don't forget to watch President Obama's speech to Congress on Thursday evening on his Jobs program proposal.

Labels: , , , , , , , , , , ,

Saturday, August 27, 2011

Stock market trend: Where we're headed

I have a series of charts this morning, but a little different than previous charts in that each are Weekly charts instead of the usual Daily charts. The value in these charts are that it takes out some of the noise and daily volatility, which makes it more difficult to discern trends.

The charts below, with the exception of the German DAX are all weekly charts covering the past year time period. You will notice there are 100 Day & 200 Day Moving Averages on the US Charts. Oh and if you look at World stock market charts, they appear basically the same.


This last chart below is a Dow 5 year chart and I have drawn many lines showing various support and resistance lines. You can see that for our current time period I have drawn the same slanting downtrend, but now there is a larger context to see this timeframe and possible key levels which will either confirm we continue to drop or we have broken above resistance. For those who are believing we are going to go up from here, pay attention to the red line which crosses at 10,500 on the right axis. If we break below that, we go to the 10,000 level. Also see the red line which crosses at 11,500. That is the tiny box which defines either a rally or a major decline.


I think you get the idea now. The trend is down, we have not really gone much above the lows and it looks as though we are going lower in the weeks ahead. If you doubt that, then buy stocks and Call Options. There will be many willing to sell you their stocks.

Labels: , , , , , , ,

Technorati Profile