Tuesday, August 24, 2010

Market comments for Aug. 25th (UPDATE)

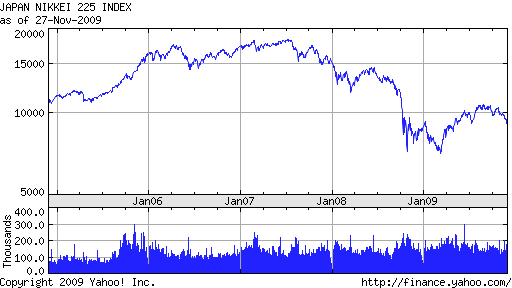
The Nikkei 225 has dropped for the first time since April 2009, to below 9,000 this evening and will set the tone for trading tomorrow. From the chart above you can clearly see that we broke below previous support level of 9,000. To get a sense on how much the Dow is over valued, back in April of 2009 the Dow was at 8,000 at that time.


There is no doubt in my mind that the world markets will catch up with our market and even the Fed won't be able to help. The Dow, S&P 500 and the Nasdaq will all drop this Fall, which by the way starts officially in about a week or so.

Economic data to be released at 8:30am EST are Durable Goods Orders for July and New Home Sales for July. Expectations are that Durable Goods orders will come in at +3.2% while last month they came in at -1.2%. New Home Sales are expected to be 300K. June's data came in at 330K New Home Sales.

UPDATE: 8:30AM EST AUG. 25TH

DURABLE GOODS ORDERS came in at +3.0%, which is less than expected, but the Ex-Transportation data came in at -3.8%. That is terrible, as expectations were that they would come in at +0.5%. Last month's number came in at -0.9%, so that is another month down. New Home Sales comes in at 10:00am EST. Expectations are the number will be 300K. Stay tuned! Futures are down on the Dow to -57 so far.

UPDATE: 3:45pm EST
New Home Sales came in at 276K, a little less than expected. Also the previous month was revised downward from 330K down to 315K.

Labels: , , , ,

Saturday, May 22, 2010

Complete market analysis from 6 months to 30 years

To help others see how trends are formed, I will use the same analysis method that I used yesterday on the Dow Intraday Charts. I used these charts to predict the trend to follow. Let's look back at various timeframes, from as little as 6 months, to as long as 30 years. This context should help others understand why I have been sounding the alarm to be cautious now, as we are about to witness a crisis of confidence unparalleled in our generation. But let's not get too much ahead of ourselves. I will start with a 6 month chart of the Dow as the Index for comparison. First the chart, then the discussion will follow each chart. Look for the "W" patterns underlined in Red and notice the slant of the red line and what trend followed immediately after the last leg of the "W" pattern.

As you can see above for each "W" pattern, a Red Line under the 2 bottom points identifies the "W". It shows the direction of the trend to follow. In this case for the 6 month chart, the last "W" pattern formed shows we are indeed going to go down much lower after the next leg goes up. This is based on the steepness of the last pattern. So now at least short term, we know we are going down lower after the next leg goes up. I will show you in a different chart that the next leg up should go to about Dow 10.500 to 10,600 max.

Above is a 1 year chart of the Dow, where I have drawn several red lines at the "W" patterns, showing the slant and following trend. You will notice that there was a slant down of the pattern in the February timeframe, followed by a small drop after that. Then the pattern reversed, and the Dow continued its uptrend until the beginning of May.

This 5 year chart of the Dow above, shows that the Dow had 2 "W" patterns pointing down, and that it was headed lower, which resulted in the lows of March 2009. However, after that, a reversal drove the market back up to the highs in April 2010. Not much you didn't know here, but it is revealing to see that the charts showed where we were headed in advance .

And last, but more importantly than all the rest of the charts, this Dow 30 year chart shows where we are headed, and it is lower! The second leg of the "W" pattern was at 6,440, if you remember those lows. It was a very scary time. This chart indicates we are headed lower than that. And if you have been reading my earlier posts, you know many indicators have been sounding alarm bells for a while. I refer specifically to the 30 year chart posted on May 7th (based upon Elliott Wave Theory and Fibonacci numbers), and to the previous warnings on April 10th and April 14th (using Put to Call ratio data and VIX (Volatility) Index data.) It was only in April that the crescendo got so loud that it would be foolish to ignore it .

I hope I have given you a sound basis for believing what is about to happen. The last thing in the world I want to say is "I told you so!" So please evaluate this and plan for the future. Most of you reading this work very hard to make money; you need to work just as hard to keep what those long hours have produced. One last word: The market is set to recover a bit in the following days and maybe weeks, as we go back up to 10,600 or so. This is about where the drop down should begin.

So you have more time to regain some of the losses these past few weeks, and to prepare yourself for surviving the crash. Cash is a real good place to keep your sales of stocks until things get better. I do not believe Gold is going to be the currency of choice. People aren't going to bring their Gold to the grocery store to buy milk and bread. Nor will they use Silver to do that.

Currency will still be around and even more precious, as many will have lost plenty of it, and will be selling whatever they can to raise cash. That is why prices will drop in everything, as they did in the last big housing drop. Cash will be King, as they said during the Great Depression. Those who had it survived. This world market drop will cause businesses to cut more costs, and that means people. So the unemployment rate will surely rise again. Here is one last chart to show the Global nature of this impending crash. I have a chart below of the Nikkei 225 Index. It shows their index is also heading below 7,000. The Nikkei closed on Friday below 10,000 to 9,774, down 246 points, and it hit an intraday low of 9696.

Good luck to all who read this. I love to hear from you, so if you have a comment, please leave it. Let me know if this is useful, interesting and/or educational. Oh, and don't forget to take my Mini Poll survey on the right side of this page. Thanks in advance!

Labels: , , , , , , , , ,

Saturday, April 10, 2010

Market outlook: Correction ahead amid turbulence during Greek debt crisis


I had a close friend ask me my opinion of the markets last night. I gave it to him but thought I would use the opportunity and show a chart on my Blog. In the 5 year chart above of the Nikkei 225 versus the Dow, you will notice that the Dow appears ahead of itself compared to the Nikkei. The Dow has been behind the Dow for the past 3 out of 5 years but recently has gotten ahead of itself and risen too rapidly.

The Euro has hit an 11 month low on concern that the Greek debt crisis may not get resolved in time, as Germany shows concerns about the issue. Germany is showing reluctance to subsidizing emergency loans for Greece and this may hold up efforts by the European Union to reach agreement on terms of a proposed financial lifeline for Greece.

The Dow did hit 11,000 yesterday and looks as though it has petered out. The Volume for the past week is lower than it has been recently. When Volume is low and price increases, that is a bearish sign. However, I have been saying that since the Dow climbed back to 10,600 and here we are at near 11,000. As long as the government plays will the addition of more money into the economy through a variety of measures by the Fed and the Treasury, predictions are going to be impossible with any merit. As I have said many times before, the game is rigged and it is rigged more now than at any time in my lifetime.I continue to be cautious. Painfully, I still own my short positions even while I retain stocks and have benefited the ride up of the market with my long positions. This week I bought more shares of ZSL (a Silver ETF Ultra Short) at $3.78, as Silver climbed over $18/ounce again. ZSL correspondingly hit a new 52 week low of $3.65. As you can see from the 10 year Silver chart, we are at a high price for Silver comparing 10 years of data and I do believe this is a good reason for me to own ZSL, as we are bound to correct again back to $12-$13/ounce in my opinion. Time will tell. Stay tuned.

Labels: , , , , , , ,

Sunday, November 29, 2009

Nikkei vs Dow 2 year chart


As a follow up to yesterday's charts on the Nikkei and Dow I have another chart today showing both indexes plotted on the same 2 year chart. As you can see there has begun a divergence of the 2 Indexes. The Nikkei has been going steadily down of late as the Dow continues to rise. It is my strong belief that the Dow will turn down and join the Nikkei once again, as the 2 indexes do track each other very well. At this time their spread is greater than it has been over this 2 year period.

With the Dubai troubles over non payment of their loans, this could increase the magnitude of the reversal. It's a good time to be on the Short side of this market. The ETF, TZA, should increase, as should FAZ as both are Ultra Shorts. TZA is a Triple Short of the Russell Index and FAZ is an Ultra Short of Financials.

Note, the chart is on a Log scale.

Labels: , , , , , , ,

Saturday, November 28, 2009

Keep watching the Nikkei to forecast the Dow's eventual move.


I was looking at my posts from October 20th when I said if you want to know where the Dow was going to go, watch the Nikkei 225 Index. As you can see above the fist chart shows where we were back on October 20th and it showed we broke above the resistance line but then retreated back below it. The 2nd chart shows where the Nikkei last closed. You will notice that the Nikkei did continue to go lower and, in my view, it foretells of the fate of the Dow. (Note, all 3 charts are on Log scale and are 5 year charts.)

The third chart below is a 3 year chart of the Dow. If you look at both the second chart above of the Nikkei and then look at the Dow chart below, it appears that both Indexes have retraced back to there they were near the end of October of 2008 where both Indexes dropped precipitously. There has been a divergence between the Nikkei recent drop and the Dow. It is clear to me that the Dow has gotten ahead of itself.

Labels: , ,

Saturday, November 14, 2009

Market summary and outlook as we approach November Options expiration week


Friday the 13th turned out to be an important day after all in the stock market. It turns out that the Dow broke up above the downtrend line today as seen in the 3 year chart of the Dow above. While it is not a decisive move, it nevertheless was significant on the face of it. The only data missing to make this move up more profound was the Volume data. You see with the market move up this past week, Volume was down unfortunately. So this move above the downtrend line may be short lived. Yo can see this drop in Volume by looking at the 6 month chart of the Dow also posted above.

The S&P 500 barely closed over its upper resistance level of 1090 and closed at 1093. Next weeks action is important for several reasons. First, next Friday is November Options expiration. And secondly, if we truly have broken the 3 years downtrend line next week will determine whether there will be a follow through above the line or not. If we drop below the line and fail to stay above it, then the Bears may seize control of the next major move. Watch Volume too for helping to decipher the true bent of the market. It should be interesting to watch daily because I do not believe it will sustain itself and stay above the 3 year downtrend line.

I have also added a chart of the Put to Call ratio from 1/2/08 to the close on Friday. It will give you some sense of where we are versus where we have been with this indicator. I have also shown with red lines where I said back in August when we hit a 2 year low of 0.59 on this ratio that it was a time to start to unload heavy positions, take profits off the table and get ready for a correction. Since that time the index has a trajectory of up but the Dow has gained an additional 7.6% to the close Friday. For those who ignored my calls to start selling and taking profits off the table back then, congratulations, you made an extra 7.6% gain.


I have one other piece of data which convinces me we are not going to stay above the 3 year Dow downtrend line and that is the Nikkei 225 Index. You can see from the chart below that we have a similar pattern as the Dow over this 5 year chart, but the Nikkei has not broken above its downtrend line. Because of this I believe that the Dow will slip back below the resistance line next week.


I will make one additional point here for my own defense, I had warned many to get out of the Nasdaq when it too was climbing that steep climb in the year 2000 to a peak of 5,000. I sent the alarm at a Nasdaq level of 4,000-4,200 to take profits off the table as back then the Put to Call suggested a major change in direction was ahead of us. Those who ignored my words back then made an additional 20-25%. But then the market plummeted to 2,500 and those who continued to hold lost 50% of their holdings. My point is no one, especially me, can time the market. But I would rather be a bit more conservative than taking imprudent risks. Good luck in whatever you feel comfortable with and may the force be with you. :)

Labels: , , , , , ,

Tuesday, October 20, 2009

Want to know where our stock market is going? Watch the Nikkei!


I thought I would take a look at where the Nikkei stock market Index was currently and specifically how the long term chart looks compared to the current wedge pattern we are in and waiting for a breakout either to the upside or downside. What I found in the chart was most intriguing. As you look at the similarities from the Dow chart, you will see the similarities are uncanny. But more importantly, there is a clue as to where the Dow may be headed. It may break below the support level line, just as the Nikkei has recently! You may need to click on each chart and enlarge them to see what I am talking about, but it is worth the look.

The Nikkei chart suggests we will not break out to the upside but may well drop shortly and break the Dow's support line.

Labels: , ,

Friday, July 10, 2009

Both short and long term stock market outlook: Successful retest of the lows and then a Bull market rally

As today closes the week of the stock market, I was influenced in posting what I did today by a commentary yesterday on CNBC by a technical analyst who had a chart of the World stock market Index which showed all markets had started to drop in the May and June timeframe. This drop was consistent across the world and was not particular to the U.S. stock market. He said it implied this drop is a world phenomena and therefore it will take the world to solve it.

I have been following the Nikkei 225 stock market Index for some time but have never posted it and the Dow as 2 separate charts on my site until now. The main thing to compare is how quickly the Nikkei showed the downturn coming before the Dow has but both charts are similar when looking at a 3 year history. Below, in the first chart, the Nikkei 225 shows they have had a double bottom which was down to about 6,500 and if we return they will have put in a triple bottom. Usually triple bottoms are solid enough of a support level foe the possible beginnings of a real Bull market rally. This is what I will be looking for as the months going into the Fall will tell if this plays out.


The Dow chart below shows we did not have a double bottom yet and that is part of the reason I am quite confident we will retest the low of 6440 on the Dow, by this Fall and certainly by October Options Expiration, which occurs on Friday, October 16th this year. This could signal the moment of an attempt of a return to the beginning of a Bull market rally, which would go above the previous high end of the range of 9,300 on the Dow. This time the S&P 500 could go back above 1000 and it will be the time when I am buying heavily at hopefully the market lows. Time will tell if this scenario plays out as much is unknown as to the outcome of the crisis in the economy. But it certainly would set the stage for 2010 and hopefully a more optimistic outlook as the peak of the unemployment should give hope things are going to turn around mid to end 2010.

Labels: , , , , , , , , , , , ,

Technorati Profile