Friday, December 30, 2011

2011 market investments and learnings from ETF instruments

2011 was the first year I was really invested in ETF's. I learned a lot about them but the lessons took too long to get. But there were major learnings. It is a well known fact that they were designed to be used for short periods of time and not to just buy and hold like traditional stocks. However that is easier said than acted upon, especially if you bought some and the market moved in the opposite direction you had expected.

Let me give you an example using the Russell 2000 index, symbol RUT, and comparing it versus the ETF's which represent the Index, TNA, the 3x Ultra Pro ETF and TZA, the -3x Short ETF. This means that on a given day where the Russell moves up 1%, TNA should move up about 3% while TZA should be down 3% on the same day. This is all well and good in practice of a given day, but if you do not sell on that given day and lock in your profit while looking for more the next day and possibly the next day after that, then you will be surprised at the cumulative effect that will have on your portfolio.

For 2011, the Russell 2000 has lost 5%. One would expect the following. TNA should be then down 15% and TZA should be up 15%, but that's not what really happens. Let's see what you would guess the numbers should be before I reveal them? Take a guess! Well the chart below is a chart of the Russell and TZA, which one would have thought would be up 15% for the year. Here's the chart:

Now let's look at what you would have expected for TNA versus what actually occurs. In the chart below I have the Russell plotted against TNA.

The 3rd chart is a plot of only TNA versus TZA for the 1 year period.

It took me a while to realize I needed to trade these ETF;s when I made any good profits and get over trying to get back to my average purchase price, but when I did I actually made some good moves thanks to the volatility of the market during the year. My best advice is don't buy and hold these or other ETF's for long periods of time or you will eventually lose your money. I suspect many others don't understand these ETF's and it has been a painful lesson to learn. I hope these charts make it very clear and that the smae mistake is not repeated in 2012.

So what time duration seems to correlate closely or to say it another way, how long should you keep these ETF's. Here is a chart below of only 3 months comparing the Russell, symbol RUT, to TNA. During the last 3 months, RUT gained 16% and one would expect that TNA should be up 3x that amount or 48%. Well in fact, TNA gained only 39% as is seen in this chart below. So you will lose even in short a time as 3 months. Here's the chart:

The next chart is of the RUT versus TZA for the same past 3 month time period. As you might expect with a 16% gain of RUT that it would create a loss of 48% of TZA. Well as you can see the loss was greater than 48%. The loss was in fact 52%.

In summary, even a 3 month time period will cost you bigger losses or less gains than you might have come to expect. The shorter the timeframe the better the correlation.

Labels: , , , , , ,

Monday, March 14, 2011

Market comments for March 15th UPDATE

Japanese stocks overnight had a terrible day dropping over 1000 points. The Futures are showing a drop in all US Indexes of about 1.5% to 2.3%. The continuing explosions at the Nuclear Reactors are causing concerns all over the world where Nuclear Reactors are used. Many lessons will be learned here in the next few years but for now panic is settling in all countries, including the U.S. It's hard not to see a connection to the Japanese stock market and the troubles in Japan as the cause of our market drop. But our market started to drop much before the Earthquake in Japan.

I expect the market to drop again and then have a rise but the rise will be a lower high than before and we will continue to make lower lows as I have stated here for a number of weeks. If you don't want to sell your stocks, then buy a hedge like some Ultra Short ETFs like TZA, SOS, FAZ and any others that go inverse of the Indexes they represent. It will help cushion your losses. But again, think if this is a longer drop, it might be better to sell now and take some profit and repurchase much later when stocks are cheap. The chart below is my best guess at Tuesday's action in the Dow. Notice the constant slide of the Dow drop.

UPDATE 5:40pm PST

Here is the actual chart of the Dow after the close today.

Labels: , , , , , , , ,

Tuesday, March 01, 2011

Market comments for March 1st, 2011

The stock market closed up yesterday so many feel we are returning to new highs. It isn't going to happen! In every market drop there are a series of jagged patterns which make one think the market is rising. However you will notice that each move up is a little lower than the previous high and eventually a lower low is formed. I believe we are currently in that pattern. So I predict that we will not return to the previous high but will be going below the most recent low within a week or two as the market continues its decline.

The economic news yesterday was nothing to excite people, but the Fed was most likely behind the rise. Personal Spending was down for January, Also, Pending Home Sales for December were down.

One chart of the Dow for a 3 month period is being posted today. It shows the recent drop and the latest climb the past few days. I expect that the Dow will not return to 12,400 but will instead go below 12,000 in the next week or two, as it begins its expected steady decline.

A Friend and I were looking at the Dow/Gold ratio chart below yesterday, which covers from 1980 to Jan. 31st, 2011. He believes we will return as low a ratio as 1.1 as we were back in 1980. Certainly form the trend starting in 2000, we have continued to decline to a ratio of 8.5-9.0 most recently from a very high ratio. The red dot on this chart is where the ratio was, as of Friday's market close, so we continue to drop in this ratio.

Now yesterday I was asked a question about the reverse split of TZA and what I thought about it. Well truthfully, not much, as as the questioner had pointed out, the value of the ETF remains the same in a reverse split. But it can have a psychological impact on some because they think that the ETF must rise so much more than it did before the split, for them to break even or make a profit from where their average purchase price was. Yes it does have to move up more $ dollars now than before the split, but percentage wise it is exactly the same. So again, I don't worry about it at all.

Labels: , , , , , ,

Tuesday, February 01, 2011

Are the new highs believable? You decide!

I have looked at the Dow 3 month chart tonight and what seems clear to me is that while we hit a new high today on the Dow and the S&P, when you look closely at the Volume today, you can see that Friday was the highest volume day. Yesterday's volume was higher than today's volume, which means that today's volume was the lowest of the past 3 days. It didn't convince me that we are now in a Bull market as some have claimed today. Take a look yourself at the chart below and you decide!

Today I purchased more TZA shares for $14.27/share. I know, you think I'm crazy. :)

Labels: , , ,

Saturday, November 27, 2010

Market comments for the week of Nov. 29th

Good day everyone. Hoping you are resting and catching your breath this longest of holiday weekends. You all work hard and once in a while you get a chance to rest so I hope you are taking it and resting as hard as you work.

Today I have 3 charts I am posting below. All 3 charts cover the past 3 months and all have 25 and 50 day Moving Average lines on them. You will notice that both the Dow and S&P500 are in a tight range between the 25 and 50 day Moving Average lines. The 3rd chart is of the Russell 2000 and it has a noticeably different chart pattern. It has remained above both the 25 and 50 day Moving Average recently. I believe that this Index is in an overbought condition and should have a larger drop when the breakout occurs to the downside. The Russell 2000 Candlestick pattern was a Hammer on Friday. So we shall see if this reverses the uptrend.


I have received many questions as to whether TZA will ever recover from the losses piled up on this Ultra Short ETF. That's a great question, but like all market moves, I can't tell you. All I can say is that I firmly believe we are eventually going to have a major market correction and retest the lows on the Dow of 6440, and when that happens many are going to be very scared. Whether the trigger is a Sovereign debt issue in the Euro zone or an economic trigger here as many believe QE2 from the Fed is killing us by death of 1000 cuts at a time.

In the meantime, live life the best you can to its fullest, as life is short. Spend quality time with family and tell them you love them. And as the Christmas holiday approaches, do something for the least of us, as you will feel good when you do. Whatever you have it's more than many in this world.

Labels: , , , , , , , , ,

Sunday, July 18, 2010

Stock market outlook: Protecting your Assets


As shown above, the 2 year Dow chart shows that we have made lower lows now 3 times as signified by the Blue lines. Also shown is the recent "W" pattern which is signified by the Red line. Notice that it is slanting down. This means that most likely we are in for another lower low, which should easily go below the 3rd Blue line. This pattern of lower lows and lower highs should continue through the Fall and into 2011 with the economy facing the real prospect of Deflation and no job growth.

What to do, what to do in the face of these problems? I can't tell you what to do, but I can tell you what I am doing. I am paying attention to all the data I can and look at my own assets daily as to where they are and how best I can take advantage of the knowledge I have acquired and the analysis I have done. For example, Treasury two-year note yields fell to a record low as reports showed that consumer confidence plunged to the lowest level in a year and retail sales declined, heightening concern the economic recovery is stalling. These all are consistent with a stalled economy and increasing the risk to us.

Yields on 10-year notes traded near a 14-month low this week after minutes of the Federal Reserve’s June meeting showed policy makers noted that risks to the recovery increased. Housing starts and sales of existing homes declined last month, reports next week are forecast to show. So in face of this information it is almost impossible for the stock market to go up. It will go down. So being long and staying in stocks is foolish, unless you are considerably hedged to the down side. I have sold many of my stock positions but have several still that I know will not drop much with a market retreat and will have a minimum effect on my total portfolio. I have shares the ETF Ultra Short of the Russell 2000 Index, symbol TZA. This is a Triple play, meaning that for every 1% the Russell 2000 goes down, TZA goes up 3%. I also have TZA Option Calls for October and for March. I have traded these twice so far and the shares I currently own are all from the profit I already have made so there is no chance to even lose my original investment. If these rise significantly, as I expect they will, I can more than double my investment in them.

I also own shares of the Banking Index ETF Ultra Short, symbol FAZ. These I expect to also rise in value. I have also purchased some other Put Options on stocks I know will drop with the market drop. I also own ZSL, which is an ETF Ultra Short on Silver. So I am a very defensive mode at this time and plan to become even more defensive going forward. Much will depend on the rate of deceleration of market Indexes. This is unfolding at a slow rate currently but the pace will increase sharply one of these days in the next month. pay attention to your portfolio. Talk to your Financial Advisor regularly if you are worried. Make sure you can sleep well at night as things are going to be very scary. The Fall is coming faster than you think and you remember what the markets do in September and October. TAKING ACTION THEN WILL BE TOO LATE.

Labels: , , , , , , , , , , ,

Tuesday, June 29, 2010

Market outlook June 29th

Did you miss me? I took a few days respite from writing about the stock market. But here I am again. Consumer Confidence numbers just came out a few minutes ago and it wasn't good. The June Consumer Confidence came in at 52.9 versus a May reading of 62.7, which is a huge drop. Stock markets around the world are down this morning triggered by revisions downward in China of their economic data. The Dow has dropped below 10,000 and as low as 9,889. Currently it is sitting at 9,914. That's about a 200 point drop. The Nasdaq is down 66 points to 2154 and the S&P 500 dropped to 1048 down 26 points. All of these Indexes have dropped below their Intraday lowest Support levels.

It is still too early to tell from the chart above, whether the market will go lower or bounce up on technicals, but if I were a betting man, and I am, I would say we are going lower today and setting up a very bad Unemployment report due out Friday as we go into July.

You can't say that I haven't given plenty notice here that this was coming. And remember, this is just the beginning of a very painful decline. Cash will be King, so make sure you are raising Cash.

TZA Options are rising very nicely today as the stock also fairs well on this decline.

UPDATE: 7:55am PST

The Intraday chart has formed a very steep slanting downward "W" pattern. This suggests to me we have not hit the low of the day today. Keep checking back.

Update: 4:00pm PST

The markets closed earlier today and I was not surprised as we did go lower as I sated we would in my earlier comments above. As you can see in the full Intraday chart of the Dow, the low today was 9,811 but closed at 9,870. If you will notice the second red line I drew under the last "W" pattern near the close, it shows the "W" slanting down. I interpret this to mean we will most likely start down tomorrow and hit a lower low. We could test 9,800 tomorrow. We are at the low of June 8th again and most likely this level will not hold.

Labels: , , , , , ,

Thursday, June 24, 2010

Market outlook: June 24th with Updates

This morning's economic data has been reported. First, May Durable Goods orders were down -1.1% for May. It was up over 3% in April. This is the first month it has been down in 9 months. Then Jobless Claims were reported down to 457,000 from 476,000, a drop of only 19,000 claims. But that could be because Congress did not pass extending Unemployment benefits for the long term unemployed. So I wouldn't be feeling better over the smaller number quite yet. Of course they haven;t mentioned that in the numbers or the media because they don't want you to be feeling anything but good right now. It's called manipulation. Have you ever asked yourself this, If the economy is truly doing better wouldn't we be feeling that and there wouldn't be a need to manipulate us? Hmmmmm.

Moving on, Futures are pointing to a lower opening. The Dow is down about 35 points, the Nasdaq is down about 14 points, so we shall see how this day unfolds together.

The chart patterns for the Dow, S&P, Nasdaq and Russell, according to ElliottWave Forecast web site, shows Bearish outlook for the Short term (Weeks to a Month), Medium term (1 to 6 months) and Long term (6 Months to a year). This is the first time all three periods have been Bearish.

Remember those Support levels going into today. For the Dow, that shows S1 at 10,227 and S2 at 10,157. Yesterday's close was 10,298. On the upside, R1 Resistance is at 10,368 and R2 is at 10,438. I don't see us going back this high, I am more concerned about breaking below the Support levels for those still holding stocks in hopes of a turnaround. For the Russell 2000 Index, S1 is at 637 and S2 is at 631. This Index closed yesterday at 644.

Those holding Put Options on stocks or Indexes can relax right now, as when the market drops, they make money. Same is true for my TZA Call Options, as they should rise with the Russell 2000 dropping, because they are based upon this Triple ETF Ultra Short. In pre-market, TZA is up 3% with the Russell Index Futures down.

Update: 8:00am PST

As you can see from the Intraday chart above, the Dow has dropped about 110 points so far this morning. As I say that, I can see the W pattern being formed and most certainly this next leg down will go below these low levels. Watch S2 support level for the Dow as that would take us down 150 or more points in total.

Update: 12:15pm PST.

We went below S2 on the Dow and are now down about 152 points at 10,140. We still have 45 minutes to go but I believe we are going even lower in the remaining time. I do not want the market to close at the bottom today so hopeful;y it won't as it would form a Hammer pattern and that would indicate a reversal is coming and the market would go up. However, it would be inconsistent with the news out there for the market to rise. It needs to go down and we all know it, the quicker the better. As you can see there is a very steep "W" pattern pointing almost straight down to contend with here. We have now hit a new low today of 10,132.

Labels: , , , , ,

Tuesday, June 22, 2010


Summarizing where we are in the stock market after the close on Tuesday, new Support levels have been determined because of the 150 point drop on the Dow today. S2 (Second level Support) is now at 10,278 and S1 (First level Support) is at 10,360. Clearly we went through several previous levels of support and the Dow is poised to drop in coming days.

For the Russell 2000, S2 is at 652 and S1 is at 644. The Russell closed today at 646 down 14.12 or
-2.14%. Since TZA is a 3x ETF Ultra Short of the movement of the Russell, it closed at $7.00, up $0.44 or 6.71% today. I expect these shares to continue to rise and the Call Options for October and January to continue to rise. R2 (Second level Resistance) for TZA is at $7.08 as we already went above R1 which was at $6.17/share. We most likely will go above this level possibly tomorrow.

Those of you who have been following my site now know how to identify and analyze these "W" patterns which foretell of the next most likely direction of the market. In the 6 month chart above, I have identified the overall "W" pattern, you can see it slants downward as indicated by the Red line under the "W" pattern. This usually means this Index will most likely go lower than the bottom of the second bottom point of the "W". This same pattern is evident in the S&P 500 Index and also the Russell 2000. The Nasdaq index has the same pattern but the "W" slants upward, meaning this Index should go up. However this seems inconsistent and will need to be resolved over time. One scenario might be that a single stock drops significantly driving the Nasdaq down greater than the other Indexes and thus resolves the discrepancy. This could happen during earnings season which starts in a few weeks.

The Fed speaks Wednesday on Interest rates. Don't expect any new news but in spite of that watch for a market reaction. Things are not tightening by the Fed because we are in Deflation, not Inflation!

Labels: , , , , , ,

Thursday, June 10, 2010

June 10 Intraday market outlook (UPDATES)


Above is the chart of the Dow at 11:00am PST. I have added the red lines under each "W" pattern so we can see what direction the market is taking for the next little while. The first Red line this morning under the "W" pattern showed a slant down, which was fulfilled as the first leg of the second "W" pattern formed. Now this second Red line does slightly slant up. So It looks like a short rally again was in the cards and is now fulfilled. We may form another 3rd "W" pattern from here so look for the direction of the slant to decide any trades. At this point there is no way to determine the direction in the last 2 hours of trading. But I am watching.

I did purchase more TZA Call Options this morning for October Expiration at a Strike Price of $9.00 for a price today of $1.68 each.

UPDATE: 11:45am PST
So the last prediction has manifested itself and the Dow Intraday is up 241 points at this moment. One thing I noticed today is how low the Volume is going into the last hour of trading. Caution, low Volume with price rising is very bearish. I won't get trapped buying stocks right now. I added a Put Option for a stock I will leave unnamed, because the price was right. It was for an October Expiration.


UPDATE 5:00pm PST
The Volume really picked up in the last hour today as did the high for the Dow. This may be the beginning of the rally I had predicted to Dow 10,500-10,600 a few weeks ago. However, this time, I will not try to make any money on this rise from the same things I did a few weeks ago, which was to buy TZA Puts. It is too risky to be betting on a Rally of the market.

Labels: , , , ,

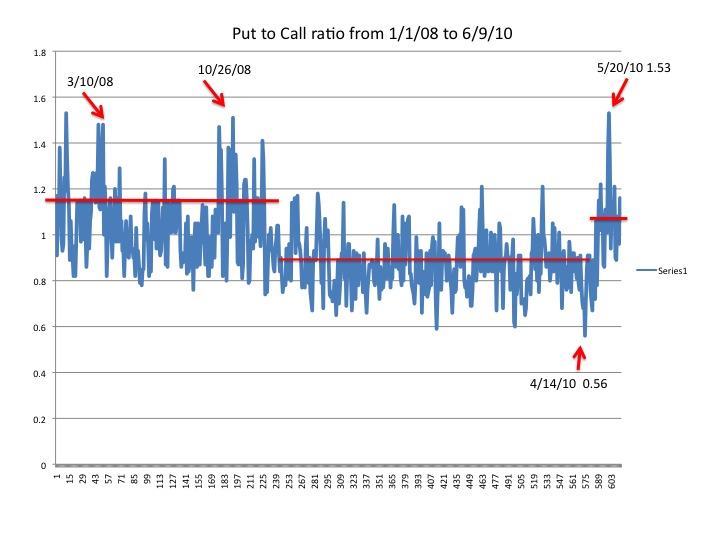
Put to Call ratio chart compared to the Dow


I thought today I would post a chart of the Put to Call ratio from January 1st, 2008 to the close of yesterday's trading. On this chart I have drawn 3 red lines to show the shifts this ratio has made. The recent shift occurred similarly back in March and October of 2008, when the market signaled it would reverse the trend and go down sharply. I am of the opinion that this 3rd shift up in the Put to Call ratio is the canary in the coal mine that portends of the market drop similar to 2008.

I have also posted the Dow for the same time period with arrows on key dates for comparison. The pause in the current market decline is temporary and while it is tempting to me to buy some Call options on some stocks, it is a foolish thought, as the overall trend in the market is negative.


As you can see from this 2010 Put to Call ratio chart above that we are defintely in a higher period as more and more people are not believing all the hype that things are getting better and the recovery is stable right now. This would indicate to me that people don't believe it as they are buying more Puts to protect themselves. It's the mood of people stupid! It is negative!

It would be a better use of my time to Buy some various Put Options on stocks or Indexes, or buying Calls on TZA. Remember, TZA is already a an Ultra Short ETF which goes triple the daily move of the Russell 2000. Good luck out there today. The Futures point up after a benign Jobs report this morning. I may post additionally today Intraday charts and analysis. So check back.

Labels: , , , ,

Tuesday, June 08, 2010

Dow Intraday pointing down while TZA pointing up (Update)


The Dow Intraday chart today, June 8th, is pointing to go lower, as can be seen by the chart above. As you can see by my identification of the "W" pattens and the slant of the "W" the direction to follow.

In addition I have placed a 2 month chart of TZA. For those new here, TZA is an ETF Ultra Short of the Russell 2000 Index. It is a Triple movement Ultra Short. TZA goes in the opposite direction of the Russell. So if the Russell 2000 drops 1%, TZA goes up 3%. As you can see from the chart below, this "W" pattern is slanted up and so is TZA. It has made a breakout to the upside. You might even want to look at a 1 year chart of TZA. Do yuo think money could be made here? :)


UPDATE 12:30pm
Well as you look at the Intraday of the Dow below you can see the last "W" pattern is slanting down. This usually says we are going lower than the bottom right leg of the "W". Notice the other "W" patterns did follow through on the direction of the slant after the "W" was formed. We shall see!


Update: 1:15pm Market closed
Well I made a mistake as I was in too much of a rush today in my last 1/2 hour update. I missed the larger "W" pattern which had formed and was so focused on the tiny one I forgot that the larger "W pattern slanted up. I drew it in with a Red dash line. I am very sorry for the error. I will take my time next time and not rush. No excuses. I'm just surprised that no one called me on it and pointed it out. You had your chance. Next time. :)

Labels: , , ,

Tuesday June 8th stock market outlook


I have put together a 6 month chart of the Dow, including the latest "W" pattern trend and also posted the chart of my prediction of market direction on the 2 month chart. We will have small rallies in the market but they will only be opportunities to sell what you haven't yet or to buy Put Options to short this market. The trend is even obvious to the casual market follower. Nervousness has started to take over the main psychology and it will gain strength as many decide to abandon their least favorite stocks in this beginning phase.

I sold my MGM Put Options after a one day gain of 28%. I figured those don't come by that often. I will get a chance to buy them back at the price I bought them at on Friday which was $1.12. Selling at $1.40 in one day I couldn't pass up.

Labels: , , , , , , ,

Friday, June 04, 2010

Friday June 4th stock market commentary


The jobs numbers came out this morning. It's obvious that the government was responsible for job creation by hiring Census workers. Private sector jobs were up only 41,000 jobs. This was taken by the market very negatively. The Dow Futures before the report were at -60, but after the report they dropped to -200. I expect this to start the decline in the markets and to follow my predictive pattern I posted here in previous posts and repost today below, as well as what the market has done since this prediction.. This is going to be a bad day and Monday should follow through on today's drop.

You will notice from the chart above that the Eurozones Blue Chip Index looks bad and was pointing down even before the Jobs report, but the jobs report drove all of Europe's Indexes lower. Most are down about 2.5% currently.

I will add Updates on this same post during the day with comments and charts, so come back and see what has been added.

I am thrilled I am on the right side of this trade now by selling my TZA Puts yesterday and Buying the TZA Calls. Remember TZA is an ETF Ultra Short of the Russell 2000 index, symbol $RUT. So buy buying TZA Calls, the purchaser believes the Russell 2000 will be going down. TZA is a Triple short, meaning that for every 1% move down on the Russell 2000 Index, TZA moves 3% up. It is one of the most leveraged Option plays in my view.


Update: 7:00am PST
With 1/2 hour into the trading day, the Dow dropped down as expected about 205 points, but has recovered only about 25 points off the bottom. I haven't posted the Intraday chart yet, but it looks like a "w" pattern was formed and is slanted down. So I believe we will take out the current lows of the day and go lower.

Update: 9:40am
As the Intraday chart above shows we did go lower this morning. But if you look at the red line I have drawn, it points to even lower levels between now and closing. In view of this I purchased more TZA Calls for October for $1.50/share with a Strike Price of $9.00


Update: 11:00am PST
OK, here is the proof in the chart above that we did go lower. I do not know how low we are going today but several things are noteworthy. First, the volume is high today for this time at 120 Million shares traded on the Dow. Also, the Put to Call ratio has moved from 0.60 in the first 1/2 hour of trading to 0.91 this hour.

Update: 12:40pm PST
There's 20 minutes to go before the market closes. The key today will be if the Dow closes at the lows. If it does, it may mean a reversal of the market next Monday or Tuesday. If it doesn't, we have more downward momentum to go. Stay tuned as we are down 346 points!

Labels: , , , , ,

Thursday, June 03, 2010

June 3rd Market Continual Updates.


It is not clear today which direction the market will go. The Intraday chart of the Dow above offers no clear clues as of 8:00am PST. I have readjusted my prediction of the Dow's high on this Bear Market rally. I do not believe we will get over 10,405 and the S&P 500 won't go over 1,116 based up upper resistance levels.

I sold my TZA Put Options a few minutes ago for $1.25/share. These I bought last week for $0.90/share. That's a 38.8% profit less less trading fees. At the same time I purchased TZA Call Options for $1.28/share for October Expiration at a Strike Price of $9.00/share. I still had some of these shares I had purchased for $0.58/share and had sold most of them at $1.90/share for a 286% profit. So being able to buy these back lower is indeed gratifying since it is my belief the market is going to go down dramatically in the future and I want to be on the right side of the market trend when it does.

Update 8:50am PST
As you can see from this Chart below, the trend is clearer, we are going to go below the "W" pattern. Notice slanted down "W" pattern.

Update: 11:00am PST

This is the latest update at 11:00am PST. You will observe from the chart below that indeed the market id go down into negative territory as the earlier update said it would. I have drawn red lines under 3 "W" patterns. The first one did slant lower and the chart shows it did go lower. The second one was slanted up and the market id go up as predicted, but the 3rd one is slanting down at this hour and foretells of the market dropping below currents levels to below the 2nd leg of the last "W" pattern. You can use this technique to trade on a more timely manner and know better where to set the Buy and Sell prices, if you can predict short term direction.

Update: 3:30pm PST
The market closed almost where it began today as indicated on the chart below. Of particular note was that my last prediction from the 3rd W pattern suggested we would go down form there which we obviously did not. So that was a failed prediction. That happens sometimes, as this is not science but an art form. Out of a dozen or more recent predictions, this was the only one which did not pan out as expected. It doesn't negate the validity of the theory however, but rather, helps show it is not foolproof.

I took the opportunity today to unload my TZA Puts which had an Oct. Expiration at a Strike Price of $6.00 for $1.28/share. These were purchased last week for $0.90/share. So I made a 39% profit on them before trading fees were included. I purchase more TZA Call Options today for Oct. Expiration with a Strike Price of $9.00 for $1.28/share. Remember I had bought these shares a few weeks ago for $0.58/share and sold most for $2.25/share. I was grateful to be able to repurchase those shares today for $1.28/share. I also still have some original shares from $0.58/share which hadn't been sold. And lastly, I purchased TZA Calls for January with a Strike Price of $12.00 today for $1.48/share. The thinking here was that the market will drop in the Fall months but may not be finished so buying some Options with a January expiration adds more insurance to my strategy.

Labels: , , , ,

Monday, May 31, 2010

Stock market outlook: Volatility will abate somewhat this week.

I wanted to summarize the data for Friday and where we were last in preparation for tomorrow. I checked on Friday's Put to Call ratio at the open on Friday and it was at an amazing 2.10 within a half hour of the open. It closed on Friday at 1.21 and while that is much better the day sets up a rally for Tuesday or Wednesday. Those are extraordinary levels and the 2.10 extreme and a buying signal.

The VIX closed at 32.07, up 2.39 or 7.5% with the high on Friday at 33.30. I am waiting for a rally on all Indexes with the Dow going to 10,500 to 10,600, before it reverses and the market goes down again significantly. I expect volume to drop somewhat as the market rises and then to pick up on selloffs.

I still like TZA Options to trade and plan to over the coming days and weeks.

Labels: , , , ,

Thursday, May 27, 2010

May 28th market action going into long weekend (Final Update)


I have posted 2 charts going into Friday's market. Both are of the Dow and are of 2 month durations. I have drawn a Blue line to show you how I came up with a top of this latest rally at 10,500 to 10,600. One chart is of Candlestick patterns and as you can see now the close on WEdnesday was a reversal Hammer pattern indicating today should go up, which it did mightily gaining 284 points to close at 10,258. Investors may take some profit on Friday as we go into the long Memorial day weekend. But I do not see giving back all the gains made today. We only have about another 250 points before we head down again.

My TZA Puts gained today. I bought many of these two days ago for $0.90 each and today the Bid closed at $1.15 and the Ask at $1.25. Some shares sold today for $1.21, which is a paper gain of 34%.

When I sell these as we approach the comparable high for the Russell 2000, which should be around 680-700, I will also buy TZA Calls again. They should be cheaper than my last sale price of $2.25 each. Today they closed at $1.30 with a Bid at $1.15 and an Ask of $1.28. So they have dropped already to a reasonable level to buy them again, as this was a 42% drop.

The last chart I am posting below is the one I posted back last Friday when I said the market was going to drop and the pattern which was to develop. This should now close that prediction.

UPDATE: 6:00am PST.

Personal Income rose 0.4%, according to data released this morning. That is good news. The bad news is that Personal Spending dropped to 0.0%. The Consumer is saving their money, not spending it. This is confirmed by the Savings rate data which was at 3.6%. Futures point up this morning but it is going to be a back and forth struggle for this market going into the Memorial Day weekend.

Art Cashin of UBS Warburg stated on CNBC confirmed my prediction that the market is forming the right Shoulder of a Head and Shoulder pattern or what I have called the "W" pattern. He expects that if the market can hold most of yesterday's gains that in the next week or two we will go up. He too believes that we will not go back up to the highs, so my forecast of Dow 10.500-10,600 range might in fact be his thinking too. Stay tuned!

UPDATE: 6:55am PST
Data out on Chicago PMI (Purchasing Managers Index) for May was at 59.7 versus 63.8 in April. This is another piece of negative data. Dow, S&P 500 and Nasdaq are negative now. The University of Michigan Consumer Confidence went up to 73.6 in May from 72.2 in April .

UPDATE: 11:00am PST
I have posted below the Intraday chart of the Dow and have drawn Red lines to show the trend expected after each "W" pattern. The first "W" pattern, while going up initially after the "W" did finally come to a lower level. The signal now is a rise in the trend even though the Dow has gone lower at this point. Hopefully there will be a little rally to stop it from going much lower than down 150 points. The Vix has also gone up over 11% so far today to 33.30 as the market hits the ows of the day.

UPDATE: 1:20 pm PST
The market has closed and I have added the final Intraday chart of the Dow below, to prove my methods to you. Notice that even after the last Update above, it looked as though we were going lower than the 150 point drop, that I said the "W" pattern had pointed up and that we would go up. Well we did. As a matter of fact, even the folks on CNBC thought we might actually go up at the end of the day, until the market sold off again. But, it you were trading today, interpreting charts can give you the edge and, as I have shown, it is not difficult if I can do it.

Labels: , , , , , ,

Wednesday, May 26, 2010

Market rally now looks obvious, but be aware it is only temporary.


Yesterday's reversal and return to an almost unchanged level sets up today the rally back up to about 10,500-10,600 range over the next week or so. The final leg of the last "W" pattern is being formed if you look carefully at the chart. There is no way to know for sure its length or duration, but one thing is for sure, after this leg up we are headed down to retest this support line and I believe it will fail to hold. The chart above shows 2 other things. First it shows a reason why the market didn't go lower yet. It was at a significant support level that if and when it is broken will result in a significant market drop all the way to about 7,800-8,000 level as the first major plateau of this return to a Bear Market.

The market should be heading down with the news this morning that Durable Goods Orders for April fell, compared to March's rise. Nondefense capital goods, excluding aircraft, often called core durable-goods orders, fell 2.4% in April after a 6.5% gain in March. This would be bad news and if news really drove the market, as many claim it does, then we should have been in negative territory in the Futures market, but the Dow is up 93 points and the Nasdaq is up 22 in pre-market. I hope you now get it that the news or any news does not drive the market. It is human patterns that drive the market.

The other thing it shows is that while the markets were dropping Volume increased much beyond the previous leg up of the market. Compare the volume in the last phase down, shown within the Blue arrow, and that of the previous period of March 1st to the end of April. You will also notice that the period of February the volume was also higher in the small declining period that month. This gives additional validity to the argument we are in a Bear Market Rally.

I will ride this rally up and be prepared to sell, when the market reaches my target. I will repurchase TZA Call Options simultaneously, as we approach that target.

Yesterday, I purchased TZA Put Options for October expiration for $0.90 each share. I plan to gain on these as the market rises also on the Russell 2000, along with the S&P 500. All indexes have a similar pattern with their own Support levels if you look at 1 year chart patterns of the daily closing prices. Good luck on this next leg up. But keep in mind we are about to have a significant market crash this Fall.

Click on the chart to enlarge it for better viewing.

Labels: , , , , , ,

Tuesday, May 25, 2010

Market outlook: Higher volatility days ahead.

Scary day today for the markets. If you pay attention today, your blood pressure will surly rise as will the VIX. The Nikkei dropped almost 300 points in overnight trading for a 3% loss as did the Topix and currently European markets are also down anywhere between 2% to almost 3%. World jitters are said to blame and certainly we have enough of them. For example, concerns over the North Koreans starting up the war again with the South Koreans and drawing in China and the US. Then there's the catastrophic Oil spill in the Gulf which has been going on for a month and most likely will continue for another 2-3 months before the well is sealed. Then add to the mix the concerns in the Euro zone about the recent debt problems of Greece and now of Spain, not to mention our own debt problems, and you have a vessel holding a lot of world issues in it.

However, everyone seems to discount the fact that the charts of the markets, which are produced by trades of our collective human minds and the software, which has been used to create formulas which can execute those trades in micro seconds, have been telling us this market drop was coming over a year ago. But we wanted to believe that we were missing out on the rally if we weren't in this rising market. Well watch how you react when the market now reverses. It's the old greed and fear paradigm at play. This creates volatility in markets. So watch the VIX index rise today.

Dow Futures point today for the Dow to drop as low as the 9700-9800 range and the other Indexes point to a similar move. If you are new to this Blog, you might want to read back issues of this Blog ofr the past 6 months or so, sampling the various warnings I had posted. I will summarize the message here as follows: We are headed eventually here to testing the previous market low of 6,440 and it will not hold ultimately. Prepare your portfolio for this and your psyche. It will not happen all at once but rather will play out over the next year or so. But it will play out!

If you haven't noticed lately, 3 Month Libor rates have doubled over the past few months. The rates, which are what banks charge each other for lending to each other, has gone from a low of 0.21% to now 0.54%. All in preparation of a tightening of lending even more than previously. Hmmm, you think they knew tis trouble was coming? Hmmm, Oil has gone down significantly as well. Today it is down over $2.29/barrel to $67.84. One would have thought with as large an Oil spill that the prices would have gone up. This is deflationary.

I thought we might get a relief rally back to 10,500 to 10,600 but we may not as well. I might be forced to part with the TZA OPtions I bought yesterday but it was not a large bet, so that's OK too. I still have 1/2 of my October Call Options as well as owning many TZA shares outright as well as FAZ, both of which are ETF Ultra Shorts. TZA is up to $8.20 in pre-market for a move of 7.5% after hitting a high of $8.38/share earlier.

Watch 1044 on the S&P 500 as that is where support is. If we can hold that, we can then get a rally in the next few days. If we can't we are heading lower and breaking that support level. And it's a long way down from there before another support level will stop the drop. On the Dow, that level is at 9850 and on the Russell 2000, that level is at 580.

Labels: , , , , , , , , ,

Monday, May 24, 2010

Update: TZA trade

Today I purchased the Oct. Expiration Put at a Strike Price of $6.00 for $1.12 average price. That was the same price as the closing price on Friday. I may add to my position if the market drops again tomorrow and I will try to get more cheaper, hopefully at $1.08.

I plan to sell these when the Dow returns to 10,600 more or less. I still retain 1/2 of my Call Options for Oct. expiration. They went up in price today.

If you look at the Intraday chart of the Dow below, you can see just before the final drop, a "W pattern formed with a slant to the downside. You can also see where I underlined the first "W" pattern and that the slope pointed up. That is why the Dow went up and then after the second "W" pattern went down near the close. Tomorrow is another day.


The VIX closed at 38.32, down 4.4% after being as low as 35.57, or down 9% today. So if the VIX is an indicator of tomorrow, the market should go up tomorrow. Increased Volatility would suggest a more pronounced drop, but I am betting that we will have a short relief rally over any spec of good news. Watch for it on the TV shows. They like to attribute something to when the market goes up, even if they are pulling stories with a positive spin out of their butt.

Labels: , , , , ,

Technorati Profile