Thursday, June 10, 2010

June 10 Intraday market outlook (UPDATES)


Above is the chart of the Dow at 11:00am PST. I have added the red lines under each "W" pattern so we can see what direction the market is taking for the next little while. The first Red line this morning under the "W" pattern showed a slant down, which was fulfilled as the first leg of the second "W" pattern formed. Now this second Red line does slightly slant up. So It looks like a short rally again was in the cards and is now fulfilled. We may form another 3rd "W" pattern from here so look for the direction of the slant to decide any trades. At this point there is no way to determine the direction in the last 2 hours of trading. But I am watching.

I did purchase more TZA Call Options this morning for October Expiration at a Strike Price of $9.00 for a price today of $1.68 each.

UPDATE: 11:45am PST
So the last prediction has manifested itself and the Dow Intraday is up 241 points at this moment. One thing I noticed today is how low the Volume is going into the last hour of trading. Caution, low Volume with price rising is very bearish. I won't get trapped buying stocks right now. I added a Put Option for a stock I will leave unnamed, because the price was right. It was for an October Expiration.


UPDATE 5:00pm PST
The Volume really picked up in the last hour today as did the high for the Dow. This may be the beginning of the rally I had predicted to Dow 10,500-10,600 a few weeks ago. However, this time, I will not try to make any money on this rise from the same things I did a few weeks ago, which was to buy TZA Puts. It is too risky to be betting on a Rally of the market.

Labels: , , , ,

Put to Call ratio chart compared to the Dow


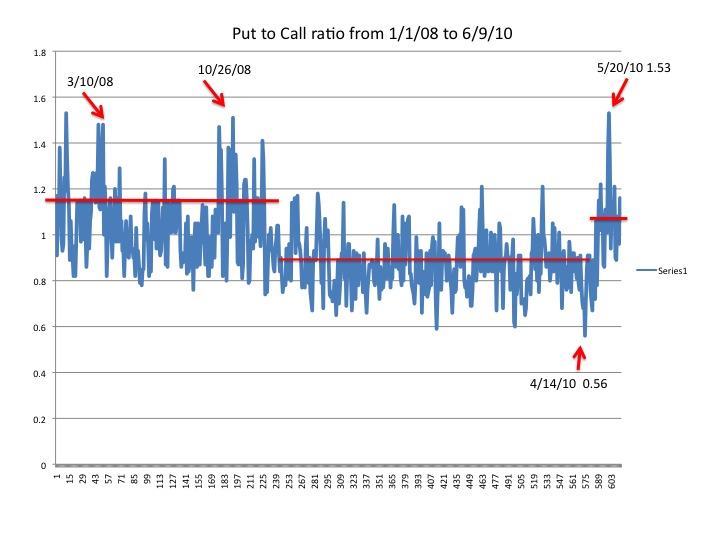
I thought today I would post a chart of the Put to Call ratio from January 1st, 2008 to the close of yesterday's trading. On this chart I have drawn 3 red lines to show the shifts this ratio has made. The recent shift occurred similarly back in March and October of 2008, when the market signaled it would reverse the trend and go down sharply. I am of the opinion that this 3rd shift up in the Put to Call ratio is the canary in the coal mine that portends of the market drop similar to 2008.

I have also posted the Dow for the same time period with arrows on key dates for comparison. The pause in the current market decline is temporary and while it is tempting to me to buy some Call options on some stocks, it is a foolish thought, as the overall trend in the market is negative.


As you can see from this 2010 Put to Call ratio chart above that we are defintely in a higher period as more and more people are not believing all the hype that things are getting better and the recovery is stable right now. This would indicate to me that people don't believe it as they are buying more Puts to protect themselves. It's the mood of people stupid! It is negative!

It would be a better use of my time to Buy some various Put Options on stocks or Indexes, or buying Calls on TZA. Remember, TZA is already a an Ultra Short ETF which goes triple the daily move of the Russell 2000. Good luck out there today. The Futures point up after a benign Jobs report this morning. I may post additionally today Intraday charts and analysis. So check back.

Labels: , , , ,

Thursday, June 03, 2010

June 3rd Market Continual Updates.


It is not clear today which direction the market will go. The Intraday chart of the Dow above offers no clear clues as of 8:00am PST. I have readjusted my prediction of the Dow's high on this Bear Market rally. I do not believe we will get over 10,405 and the S&P 500 won't go over 1,116 based up upper resistance levels.

I sold my TZA Put Options a few minutes ago for $1.25/share. These I bought last week for $0.90/share. That's a 38.8% profit less less trading fees. At the same time I purchased TZA Call Options for $1.28/share for October Expiration at a Strike Price of $9.00/share. I still had some of these shares I had purchased for $0.58/share and had sold most of them at $1.90/share for a 286% profit. So being able to buy these back lower is indeed gratifying since it is my belief the market is going to go down dramatically in the future and I want to be on the right side of the market trend when it does.

Update 8:50am PST
As you can see from this Chart below, the trend is clearer, we are going to go below the "W" pattern. Notice slanted down "W" pattern.

Update: 11:00am PST

This is the latest update at 11:00am PST. You will observe from the chart below that indeed the market id go down into negative territory as the earlier update said it would. I have drawn red lines under 3 "W" patterns. The first one did slant lower and the chart shows it did go lower. The second one was slanted up and the market id go up as predicted, but the 3rd one is slanting down at this hour and foretells of the market dropping below currents levels to below the 2nd leg of the last "W" pattern. You can use this technique to trade on a more timely manner and know better where to set the Buy and Sell prices, if you can predict short term direction.

Update: 3:30pm PST
The market closed almost where it began today as indicated on the chart below. Of particular note was that my last prediction from the 3rd W pattern suggested we would go down form there which we obviously did not. So that was a failed prediction. That happens sometimes, as this is not science but an art form. Out of a dozen or more recent predictions, this was the only one which did not pan out as expected. It doesn't negate the validity of the theory however, but rather, helps show it is not foolproof.

I took the opportunity today to unload my TZA Puts which had an Oct. Expiration at a Strike Price of $6.00 for $1.28/share. These were purchased last week for $0.90/share. So I made a 39% profit on them before trading fees were included. I purchase more TZA Call Options today for Oct. Expiration with a Strike Price of $9.00 for $1.28/share. Remember I had bought these shares a few weeks ago for $0.58/share and sold most for $2.25/share. I was grateful to be able to repurchase those shares today for $1.28/share. I also still have some original shares from $0.58/share which hadn't been sold. And lastly, I purchased TZA Calls for January with a Strike Price of $12.00 today for $1.48/share. The thinking here was that the market will drop in the Fall months but may not be finished so buying some Options with a January expiration adds more insurance to my strategy.

Labels: , , , ,

Tuesday, May 25, 2010

Market outlook: Higher volatility days ahead.

Scary day today for the markets. If you pay attention today, your blood pressure will surly rise as will the VIX. The Nikkei dropped almost 300 points in overnight trading for a 3% loss as did the Topix and currently European markets are also down anywhere between 2% to almost 3%. World jitters are said to blame and certainly we have enough of them. For example, concerns over the North Koreans starting up the war again with the South Koreans and drawing in China and the US. Then there's the catastrophic Oil spill in the Gulf which has been going on for a month and most likely will continue for another 2-3 months before the well is sealed. Then add to the mix the concerns in the Euro zone about the recent debt problems of Greece and now of Spain, not to mention our own debt problems, and you have a vessel holding a lot of world issues in it.

However, everyone seems to discount the fact that the charts of the markets, which are produced by trades of our collective human minds and the software, which has been used to create formulas which can execute those trades in micro seconds, have been telling us this market drop was coming over a year ago. But we wanted to believe that we were missing out on the rally if we weren't in this rising market. Well watch how you react when the market now reverses. It's the old greed and fear paradigm at play. This creates volatility in markets. So watch the VIX index rise today.

Dow Futures point today for the Dow to drop as low as the 9700-9800 range and the other Indexes point to a similar move. If you are new to this Blog, you might want to read back issues of this Blog ofr the past 6 months or so, sampling the various warnings I had posted. I will summarize the message here as follows: We are headed eventually here to testing the previous market low of 6,440 and it will not hold ultimately. Prepare your portfolio for this and your psyche. It will not happen all at once but rather will play out over the next year or so. But it will play out!

If you haven't noticed lately, 3 Month Libor rates have doubled over the past few months. The rates, which are what banks charge each other for lending to each other, has gone from a low of 0.21% to now 0.54%. All in preparation of a tightening of lending even more than previously. Hmmm, you think they knew tis trouble was coming? Hmmm, Oil has gone down significantly as well. Today it is down over $2.29/barrel to $67.84. One would have thought with as large an Oil spill that the prices would have gone up. This is deflationary.

I thought we might get a relief rally back to 10,500 to 10,600 but we may not as well. I might be forced to part with the TZA OPtions I bought yesterday but it was not a large bet, so that's OK too. I still have 1/2 of my October Call Options as well as owning many TZA shares outright as well as FAZ, both of which are ETF Ultra Shorts. TZA is up to $8.20 in pre-market for a move of 7.5% after hitting a high of $8.38/share earlier.

Watch 1044 on the S&P 500 as that is where support is. If we can hold that, we can then get a rally in the next few days. If we can't we are heading lower and breaking that support level. And it's a long way down from there before another support level will stop the drop. On the Dow, that level is at 9850 and on the Russell 2000, that level is at 580.

Labels: , , , , , , , , ,

Monday, May 24, 2010

Update: TZA trade

Today I purchased the Oct. Expiration Put at a Strike Price of $6.00 for $1.12 average price. That was the same price as the closing price on Friday. I may add to my position if the market drops again tomorrow and I will try to get more cheaper, hopefully at $1.08.

I plan to sell these when the Dow returns to 10,600 more or less. I still retain 1/2 of my Call Options for Oct. expiration. They went up in price today.

If you look at the Intraday chart of the Dow below, you can see just before the final drop, a "W pattern formed with a slant to the downside. You can also see where I underlined the first "W" pattern and that the slope pointed up. That is why the Dow went up and then after the second "W" pattern went down near the close. Tomorrow is another day.


The VIX closed at 38.32, down 4.4% after being as low as 35.57, or down 9% today. So if the VIX is an indicator of tomorrow, the market should go up tomorrow. Increased Volatility would suggest a more pronounced drop, but I am betting that we will have a short relief rally over any spec of good news. Watch for it on the TV shows. They like to attribute something to when the market goes up, even if they are pulling stories with a positive spin out of their butt.

Labels: , , , , ,

Sunday, May 23, 2010

TZA as a quick trade: My strategy for this week

I was looking this morning at the Options for TZA. As many know here I had purchased Call Options for TZA for October 16th Expiration with a Strike Price of $9.00 for $0.58 and sold over 1/2 of them for a 236% profit last week. I still have 1/2 and their current closing value is $1.76. I expect the market to rise this week and I am looking at purchasing Oct. Put Options at a Strike price of $5.00 for $0.65 or cheaper, depending if on Monday if the Russell 2000 index drops. I may at that moment sell the other 1/2 of my Call Options and simultaneously buy the Puts.

I am also looking at the $6.00 Put Options for $1.12. I will keep these only until the Russell 2000 goes to about 700-710 in the week ahead. It closed at 649. A lot depends on the price action and the volatility in the market this week.

The thing I like about Options trades is that they settle in one day. The ones I sold on Thursday settled Friday so I can use the same money on Monday to buy more Options. Stocks on the other hand take 3 days to settle and when you want to use the same money you must buy on margin if the trade hasn't yet settled, or add new money in the form of cash, not check as there also is a delay in the use of the funds by at least a day or so. Of course if you have enough cash in your account you don't have to worry about those small nuisances. :)

Stay tuned.

Labels: , , ,

Friday, May 14, 2010

Fair Warning: Markets about to turn down significantly!


The stock market may make another drop down today as I look at the Futures market. If it closes down on the Dow between 100 and 200 points, it will set the downtrend line as is shown in the Dow chart. This could be the turn down which accelerates and causes panic in the days and weeks ahead.


Savvy readers of this Blog used the opportunity yesterday morning or Wednesday to load up more on the TZA Calls for October 16th expiration for Strike prices of either $9.00 or $10.00/share, as they are in perfect position to rise significantly again. The second chart is of the Russell 2000 Index, symbol $RUT. You will notice from the 3 month chart that the Russell dropped over 12% in that recent dip. This has huge implications for the ETF's of this Index.

Remember TZA is an Ultra Short ETF of the Russell Index. It moves up, when the Russell Index is down and down when the Russell goes up. It moves double the move of its counterpart, TNA. So, if TNA moves down 1%, look for TZA to move up 2%. In recent market action TNA have been moving down 4%-5% causing TZA to move up 8-10%. Then if you have Call Options on TZA, as I do, these moves up can be as much as 100-200%.

I have warned many of my belief that we are headed down in all markets by a scary amount. I dare repeat that again, for having many dismiss this. Enough to say, many will be really scared when the market drops, because the bottom will seem to never come. Why not be prepared for this by taking your profits and sleeping better at night. Gold is flashing warning signs daily, as it hits new highs, even today, as it is at $1247/ounce, up another $11.00 an ounce today.

Labels: , , , , ,

Monday, May 10, 2010

How one Option moved over this volatile period.


I wanted to show you how the value of the TZA Options I purchased on the morning of May 1st, moved over time and the effect of the market turmoil last week on the price and gains. (I have also included 2 charts. One is for the period of 1 week and the other is for the past Month.)

Call Options on TZA for October 16th expiration taken at various dates.
4/30/10
Last Bid Ask Tot. Vol. Strike Price

TZA 1.87 1.74 1.88 1,987 4.00 Strike Price
TZA 1.32 1.21 1.29 1,107 5.00 Strike Price
TZA 0.97 0.91 1.04 4,455 6.00 Strike Price
TZA 0.89 0.72 0.78 3,443 7.00 Strike Price
TZA 0.75 0.58 0.69 498 8.00 Strike Price
TZA 0.64 0.50 0.58 1,408 9.00 Strike Price Purchased my contracts at $0.58
TZA 0.49 0.43 0.50 4,610 10.00 Strike Price
TZA 0.52 0.38 0.46 164 11.00 Strike Price
TZA 0.47 0.34 0.41 178 12.00 Strike Price
TZA 0.45 0.30 0.37 48 13.00 Strike Price
TZA 0.38 0.27 0.34 629 14.00 Strike Price

5/7/10
Last Bid Ask Tot. Vol. Strike Price Percent gain from 4/30/10
TZA 3.80 3.60 3.85 1,968 4.00 Strike Price 103%
TZA 3.10 2.96 3.25 1,204 5.00 Strike Price 135%
TZA 2.51 2.51 2.74 4,877 6.00 Strike Price 159%
TZA 2.22 2.16 2.30 3,449 7.00 Strike Price 149%
TZA 1.95 1.90 2.01 565 8.00 Strike Price 160%
TZA 1.74 1.68 1.79 1,549 9.00 Strike Price 172%. My gain was 190% because of lower purchase.
TZA 1.56 1.55 1.61 5,476 10.00 Strike Price 218%
TZA 1.25 1.36 1.47 340 11.00 Strike Price 140%
TZA 1.27 1.21 1.37 200 12.00 Strike Price 170%
TZA 1.13 1.15 1.26 43 13.00 Strike Price 151%
TZA 1.05 1.04 1.18 829 14.00 Strike Price 176%

As of the close today, most all were down between 12% and 38% with the one with a Strike Price of $11.00 had no change. I expect these to regain the losses that happened today as it is a long time between now and October expiration. The Strike Price of $10.00 for October seems to be attracting the largest trading volume. I would say the $9.00 Strike Price gave the second best return of these so far.

So the minimum gains are still over 80% for these and as high as 157%. I will look for any further rise as an opportunity to add to my Call Option positions on TZA.

I have been asked if this trend down is complete now and if we are starting a new trend up. My belief is that we may go up again a bit tomorrow, but this downtrend line, which started about a week ago will continue. We will zig and zag, up and down, but the pattern should become clearer in a week, when May Options expire on May. 22nd.

Labels: , , , , ,

Time to buy Options with market soaring!

It's a great time this morning, with the market up so much to buy those Options for October for those who believe this move up is only temporary. The Dow is up already over 450 points to 10830 and the S&P 500 is up 52 points to 1162. Check my earlier Blog to see what I had bought. I bought TZA and MGM Options.

Labels: , , , ,

Saturday, May 08, 2010

Stock market outlook: Thunderstorms with Tornado winds


I feel like I have been crying in the wilderness saying this correction is coming for quite a while. And most recently I have been saying so in a feverish pitch if you go back to my March 23rd posting. But it is now here and it will unfold slowly but consistently. The 3 charts today show that we have broken below support of the Dow. Oh, and all the Indexes are similar so it's not necessary to post all of them here.


We will be breaking below the 200 day Moving average shortly for most of the Indexes as we are closer as of Friday's close. The chart above, on the VIX (Volatility Index), shows that we hit a low and a high all within weeks. When we hit the multi year low I wrote here that it was a signal that the long awaited drop was near. Well it only took 2 weeks or so and here it is.


Also note the Put to Call ratio chart above, which shows we had hit the multi year low of 15.23 only weeks before this major rise up. It was a signal that there was too much optimism in the markets and it helped fuel the drop. All 3 charts are of a 1 year timeframe so you can se various moves and look at what happened in the Dow.

Now I know many of you think the worst is over from yesterday's market action. Heck, I heard on CNBC that the markets had "recovered" from the previous day's major selloff, which they still say they don't know what happened and it must have been a system glitch. In my view they will find no system glitch. This was a panic selling moment. More will come. Everyone knows the meteoric rise of the Dow since the lows had to come to an end. Those folks feel a 10% correction was inevitable. And so we have had almost a 1000 point correction from 11,400 on the Dow to 10,400, but, unfortunately, this is just the beginning of the big step down in all major markets. Elliott wave Theorists have been saying it is coming for a while as well. I posted a 30 year chart yesterday. I suggest you look at it and ask yourself this question. What do I do if this really does happen? Am I positioned to weather this kind of a drop? And lastly, Uf not, what can I do in the coming days and weeks to get more secure and less vulnerable to a major historic Bear market collapse like happened in the Great Depression.

I have many Short positions and Options currently, so that is my bias. I listen to myself and ask myself the same questions. I still see much upside movement in them. Here are two recent purchases and their status. On Monday I mentioned I had purchased a Call Option on the Ultra Short ETF, TZA, for $0.58/share with a Strike price of $9.00/share and an Expiration of October 16th. It closed yesterday at $1.74, after hitting $2.03 earlier in the day. So that one is up currently 200%. My other one was on MGM. It was a Put Option for a Strike Price of $12.00 for September for $1.15/share. It closed yesterday at $2.08/share. This one is up currently 81%. The underlying stock has closed at $13.12 and for a brief moment this week actually went to $12.52, well within the reach of a $12.00 Strike Price. And much can happen between now and September on this one as well as the TZA Call Option. I also have shares of TZA which I have held on to. I also own some FAZ, which is an Ultra Short ETF of the Financial sector. It has moved this week from about $11.50 to $15.00 for a move of 30%.

So there are other vehicles available to you if you need protection. Talk to your financial advisor. Don't put all your eggs in one basket. Consider cash a part of every portfolio. But don't do like many folks out there do. Don't look at your holdings only when a crisis appears. It's too late. You worked hard to make your fortune or are still working. Don't be a slave to events. Take some accountability for your future and manage it, rather than letting external events manage you. Best of luck. We will be visiting this issue as the days and weeks unfold the market direction more clearly to you. I have my crystal ball. I hope you do too and that you're not looking at yours through rose colored glasses.

Labels: , , , , , , ,

Thursday, May 06, 2010

Stock market drop: I told you so! UPDATE


Let's first focus on the first 2 charts of the SP500 and the Dow for a year. Those of you that read my Blog regularly know I have been warning people of the market drop. I even said in one of my recent Blogs "FAIR WARNING!" So the fact you're here means you want to know if we are going to go back up? We could go up a bit, but I believe we are eventually going way down as I have said many times recently. Go back and look at charts (March 23rd) where I predicted how far the markets are going to go down.

The Dow closed down to 10,520, down 347 points, while the S&P closed at 1128, down 38 points. The VIX (Volatility Index) closed at 32.80, up 7.89. The third chart is of the VIX and you can see that it zoomed to a 1 year high today.


I told a few friends on Monday I had purchased several Options. I bought Call Options for TZA (the ETF Ultra Short of the Russell) at a Strike Price of $9.00/share for Oct. 16th, for $0.58/share. Today, those shares closed at $1.20/share, in effect doubling my money. And I also bought Put Options on MGM for a Strike Price of $12.00 for September for $1.15/share. Those shares closed today at $2.03/share yielding a 77% gain. I still own those Options as I truly believe we are heading down, down down. Good luck out there.

UPDATE: 6:00pm PST

The Nikkei is dropping at the open and so far has dropped 433 points in 45 minutes after the open. Yesterday the Nikkei dropped over 350 points and so it appears there is more downside coming even tomorrow, unless the Nikkei recovers. I would watch to see before our market opens tomorrow as to whether the European markets are also down significantly and then choose a strategy that is right for you and your own situation.

Labels: , , ,

Tuesday, June 09, 2009

Call Options: From 10/21/03 to 6/9/09


I would like you to consider the state of the stock market now, as compared to all the years from October of 2003. My last post showed an unusually high number of Calls in the past couple of months compared to all of 2008. I decided to go back and look as far as 2003. The chart above represents the Number of all Call Options from October 2003 to the close of the market today. As you can see the sheer volume is staggering compared to all the years and there appears a significant trend up with a rising slope. Does this make sense to you given where this economy is right now? You will see the lows in the Fall of 2008 and then again in March but then the rise.

I'm just trying to make some sense of the apparent non sensical current market. I have not yet.

Labels: , , , ,

Technorati Profile