Saturday, December 17, 2011

Market comments for the coming week of Christmas

Oh I hate to be so repetitive. As I said in my last post on Dec. 5th, "I thought it was time to post on the stock market again." The main points to make this week are that all Indexes are now below their 200 day Moving average line, shown faintly with the yellow lines on each chart below. My opinion continues that this shows the tendency is still to remain below the 200 day Moving Averages in the intermediate timeframe. While there was "hope" the Eurozone had "solved" its crisis we all know better now, don't we. Unfortunately it will take a stock market crash or a sovereign debt meltdown causing a market crash before Europe is forced to come to terms with its problems. Here are the updated charts of our major indexes.


Labels: , , , , , , , ,

Sunday, December 04, 2011

Market comments for the coming week of Dec. 5th.

I thought it was time to post on the stock market again. The main points to make this week are that all Indexes, except the Dow, are still below their 200 day Moving average line, shown faintly with the yellow lines on each chart below. The second point is that while the Dow remains above the downward sloping red line, the Russell has remained below it the most. The Dow is most likely the most manipulated Index and the Russell the least. My opinion is that this shows the tendency is still to remain below these red lines in the intermediate timeframe.


This week will have its important announcements. The biggest news item will be the European meeting, scheduled on Dec. 8th and 9th, of Finance ministers to discuss resolving the Sovereign debt issues of Greece, Italy, Spain, Portugal and others. This will be the most important meeting of the last year as it is the first since the coordinated Central Bank intervention to lower the rates banks pay to increase reserves. The Central Banks took this action because there was an immediate concern of a large bank failure in Europe. Our markets will react to what happens there, not here.

Labels: , , , , , , , , ,

Wednesday, November 09, 2011

Market comments for Nov. 9th, 2011

Sorry I haven't posted recently, I was away back east to see my Mom and when I returned I had caught a very bad cold. But I'm back now and let's get at it.

I have watched the rise of the Dow recently as well as the other indexes over the 200 day Moving averages. But todays drop of between 200 and 300 points this morning, shows the strength of the 200 day MA line as a resistance level. The market actions have not made sense given the news in Europe and the fact that our own government may get downgraded as well for a second time. Greece has not really solved its problem but they did replace their leader. Italy may replace its leader as well, but replacing the leader doesn't solve this crisis in either countries and more than it would here. The problems are similar and the pain will have an impact and it is human to avoid pain. So my guess is that these problems will unfold stubbornly over time. The only solution I can see is a breakup of the EU in some fashion. Either the countries of the south like Greece and Italy will not be part of the EU anymore and possibly Portugal, or the entire EU will eventually dissolve.

Below are the charts for the Dow, S&P 500, the Nasdaq and the Russell 2000 with their 200 day Moving Average lines. Unless the market can stay above these levels we are headed lower. Needless to say, it may be true again that the last rally we had was a bear trap. More on that over the weekend.


Labels: , , , , , , , , , ,

Thursday, October 27, 2011

Markets rally strongly. What's next?

Markets rallied strongly on the Euro zone deal to solve the debt crisis in Greece. It's just a fact. The Dow surged to close at 12,208, the S&P rallied to close at 1284, the Nasdaq to 2738 and finally the Russell rallied to 765. All of these Indexes, except the Russell, surged above their 200 day Moving Averages. They all made a significant breakout, which can't be denied. And they did it on stronger volume, always a good sign for Bulls. This surge makes it possible for the averages to go back to the previous recent highs. For the Dow, that would be about 12,800. For the S&P 500 that would be 1360. For the Nasdaq that would be 2870. And for the Russell it would be first getting over the 200 day MA at 790, but then going on to 860. All this now becomes possible again. As I said, it's just the facts.

We had good economic news coincidently with this market move. GDP for Q3 came in at 2.5%, healthier than some low predictions of 1.5%, but not as strong as the highest ones which were at 3.5%. Initial Jobless claims were still over 400K this week coming in at

Can the markets reverse where they are now and go down? Yes, but if they do one might consider buying on the dips. Remember when we did that long ago? I do.

I have said to watch Europe and the DAX for clues about this market as we have been following Europe. Well the DAX and France's CAC as well as other european markets also surged today.

I have placed 1 year charts of all the Indexes below.


Labels: , , , , , , ,

Saturday, October 22, 2011

Stock market analysis and commentary Oct. 22, 2011

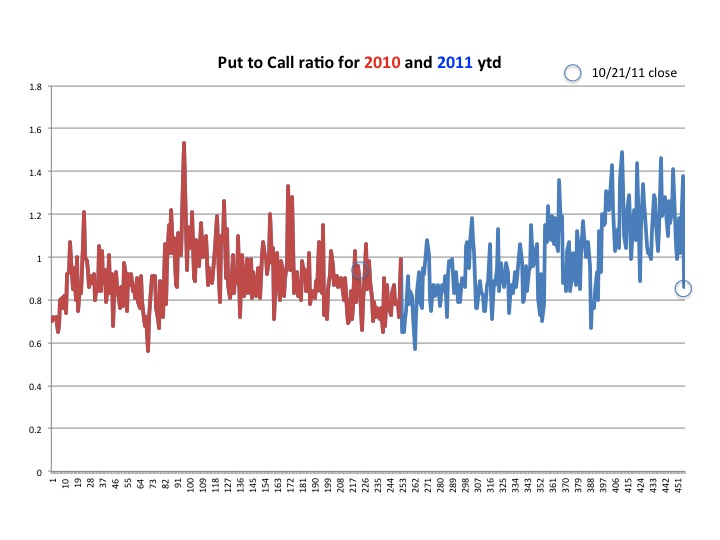
The stock market had a surge yesterday on high volume and the Dow closed at a 11,808, bringing it near a 3 month high. Of course this was done on Options Expiration day. That explains the high volume, but not the surge up on the Dow. Yesterday also had one of the lower Put to Call ratio readings as seen in the chart below. Be sure to read my last post where I said to watch this ratio to go below 1.0 and head to a 0.7 reading.

What has dominated our stock market action has been Europe and the Greek debt crisis and impending crisis in Italy and Spain. there were some hopeful comments made that the meeting this weekend of the G-20 would yield some good results. Greece's Parliament did pass more austerity measures in the face of Union strikes and violence, all giving many hope that Eurozone countries will get past this problem and on solid footing. But Germany's Merkel has said to the effect, not to count much getting done at this meeting this weekend as it will take many more meetings and months or longer to solve these crisis. It didn't matter to the market traders as they jumped on the bandwagon of "hope" and drove stocks higher as the Shorts took it in their shorts with big hits in their portfolios.

The Dow trend has clearly broken above a tight range and it could have legs to go higher. I can envision a move to 12,000 is possible, but the risks to go back below 11,000 is also as strong. The 200 day moving average is at a few points below 12,000 but the line is sloping down so I don't see us going up above this level. See the 6 month chart of the Dow with the 200 day MA below:

Much will be dependent on the news from Europe. Many think that our earnings announcements will drive the market higher, but the fact is that many companies are missing their targets like Apple, The Blackstone Group, Schlumberger, Travelers Ins., Morgan Stanley ( missed w/o accounting move) and a number of other prominent companies. Remember most targets had been lowered because of the economy so even beating them is nothing really impressive with this very slow growth economy.

The best moves have been to play the wide swings in the markets due to high volatility. But this is not for amateurs. And I consider myself a amateur, as most are because we don't have the ability to execute High Frequency trade in nanoseconds like the big boys do, so we are always too early or too late for a trade to make comparable profits.

Labels: , , , , , ,

Friday, September 03, 2010

One month chart and comments on the Dow

As you can see from the chart below, the Dow reached 10,451 today as a high, which coincidentally is just under the 200 day Moving Average. This has proven to be a significant resistance level for the Dow.

Below, the one month chart, of the S&P 500, shows that the S&P has lagged the Dow in approaching its 200 day Moving Average. So while today is a feel good day for the Bulls, they have yet to go over this important Resistance level. Overall, we remain in a tight range but the swings cause emotional trading, rather than measured trading.

Labels: , , , ,

Monday, June 01, 2009

Heck of a move up today in the stock market.

Yes, today the market soared after the rise after the close on Friday. The Volume equalled Fridays which had been higher than many days last week. It was convincing and propelled the Dow from 8,500 to the 8,700 level, closing at 8,721. This was just under the 200 day Moving Average, but both the S&P 500 and the Nasdaq have gone above the 200 day MA, and it happened on stronger volume. This is why I say it is convincing.

So where do we go from here? Well it looks like we are headed higher and, in fact, we may go back to the top of the range for the Dow which is at 9,300. The Dow is taking out both Citigroup and GM and replacing them with Cisco Systems and Travelers Ins. Co. Today some commentators said that the Dow may now become more volatile with these 2 new additions.

This makes it very difficult for those holding Shorts like TZA and SDS as I am. I had several friends ask me today what to do if they still hold them. Here's what I said. First you must ask yourself a couple of questions. The first is this. Do you believe we are not going to go back to 7,300 on the Dow? If the answer is I don't think we will go lower and retest 7,300 or lower, then you should sell those Short positions. If you think we will eventually go back and test that level, as I do believe we will, then hold on and wait. You could buy more shares as your positions continue to deteriorate and average down from your current price. I will tell you what I am going to do. I am going to continue to hold my shares of TZA and as the Indexes continue to rise, I will wait and buy more shares of TZA cheaper and hopefully will be rewarded before years end. As most of you know from reading here, I believe we will have a major drop and retest most likely in the Sept./Oct. timeframe.

I did not expect this rise with still all the bad news out there and most everyone knowing Friday's unemployment numbers will be about 9.2%. But I said I would say I was wrong if I was. I was wrong when I thought we would have the pullback. Sorry friends. But I never promised you I would be always right, either! It doesn't make sense from where I sit that the market would be going up, but I can't fight the facts. I do believe this is a false sense of comfort and I still caution to preserve capital. I felt this way back in the year 2000 and felt then like I was crying in the wilderness as everybody wanted to jump on the gravy train of a higher Nasdaq because of the Dot Com bubble. I said to go to cash then too, 6 weeks before the big drop. But most didn't head my warnings except a few that did and were thrilled they had. Stay tuned!

Labels: , , , , , ,

Thursday, May 28, 2009

Market Outlook for May 28, 2009

Futures point up this morning as Durable Goods Orders showed a 1.9% gain for April. But March numbers were revised down 2.1%. All 3 Indexes show small moves up this morning and are not something that can be counted on for the day. While Weekly Jobless Claims were reported down this morning to 623,000 for the past week. But Continuing Claims reached a new high at 6.79 Million.

Still there is a lack of clarity as to what the strategy is for the Government regarding trying to keep mortgages available with cheap interest rates but the Treasuries for 2 year and 10 year duration seemed to suggest rates will be rising, which would seem to thwart the Fed's plans to keep Mortgage Interest rates low. The Bond market is getting nervous and hence the big swing down yesterday.

Oil is up again to $63/barell. Gold hovers around $955/ounce as Silver has moved over $15/ounce. European markets are all down this morning as well.

As we travel through the no mans land of 8,200 to 8,600 on the Dow waiting for a clear direction, none seems to be showing itself. But pressing the markets continues to be the decline in the 200 Day Moving average daily for all 3 Indexes, the Dow, Nasdaq and the S&P 500. If I were to guess, and we all know that's all it is, I believe the market will be down again today but not by more than 100 on the Dow. We are going to stay in this tight range until some news breaks to drive these markets decisively. That could take the whole summer, I'm sorry to say. Or there could be something Internationally which triggers the drop.

Labels: , , , , , , , , , , , , , ,

Wednesday, May 27, 2009

Market summary for May 27th

Today started positive in all 3 Indexes, the Dow, the Nasdaq and the S&P 500, but they all ended down today, giving up much of yesterdays gains on about the same, to slightly higher volume. The volume is still low considering the 50 day Moving average Volume. The Nasdaq continues to flirt with trying to staying above the 200 day Moving average, as it has stayed above the 200 Day MA for 4 days in a month. For the past 2 days it has managed to stay above it, which currently crosses the axis at 1,700. Today's close was at 1,748. Tech's have led the Market up for the past 3 months, but seem to have staled out at the 200 day MA the past 2 weeks.

The Dow closed today at 8,300. The 200 day MA crosses the axis now at 8,900. While there still is room for the Dow to climb, it too has stalled the past 12 days in a tight range of between 8,200 and 8,600. The Dow's volume has been below the 50 day MA volume 19 out of the past 23 days. We need to have a breakout either above or below 8,200 and 8,600 to see where the next trend is going to take us. To me this and especially the 200 Day MA line are is going to limit the upside move.

The S&P 500 closed today at 893. The 200 day MA crosses the axis at 930. We reached a climax on this Index on May 8th when the Index closed at 930. Since then we have taken a step down. The range here is from 885 to 913. This 200 day MA is dropping at a rate of about 15 points a week. So if we stay exactly where we are now, the 200 day will be pressing on the Index to go lower in 2 weeks. That should take us past the Unemployment numbers for May as well as the GM bankruptcy to determine the impact on the market.

Treasuries rose sharply today as the curve between 2 year and 10 year was the steepest on record on concern surging sales of U.S. debt will overwhelm the Federal Reserve’s efforts to keep borrowing costs low. Ten-year notes have lost 10.3 percent this year, according to Merrill Lynch & Co. indexes, while 30-year bonds have lost 27.5 percent. The unprecedented government borrowing has created concern about a rise in consumer prices. Policy makers have expanded the Fed’s balance sheet to $2.2 trillion while excess reserves at U.S. banks have increased to $896.3 billion.

The VIX closed up and closed at 32.36, while the Put to Call ratio closed at 0.86, up from yesterday's close of 0.72 for the day.

Labels: , , , , , , , , , , , ,

Tuesday, May 26, 2009

Market summary for May 26th.

I know, the market went up today. So be patient. In my last post I said it would be like a staircase. We may go as high as 8,900 on the Dow before we drop. Just because we spiked up today on nonsense measurements, i.e. Consumer Confidence, the real estate data was terrible, reenforcing the notion that the decline has not stopped or turned. It was painful to see a big drop in TZA today. What did I do. I bought more shares as low as $25.60/share.

The Put to Call ratio closed at 0.70 while the VIX closed at 30.26. Remember watch the Dow and S&P 500 Indexes 200 day Moving averages, as a guide to where we are headed.

Labels: , , , ,

Tuesday, May 19, 2009

Pre market outlook for May 19, 2009: Cautious

The big news this morning was Housing Starts for April coming in at record lows and new Building Permits as well. The Futures were all showing today was going to be an up day until this news came out. Also, Home Depot beat analysts expectations on their earnings reported for the quarter, but they got there by closing stores, laying off people and cutting other costs. You can't cut your way to growth. You either have it or you don't. Revenues for Home Depot were down 10% and that is the real story in my view.

I was asked by a friend where the market was going as it has been still pointing to a continued uptrend as yesterday's market action was green in all Indexes. I said to my friend this was true but Volume was pathetic. Art Cashin on CNBC this morning also commented on this. He said that people he talks to are very divided on the direction of the market. He said about half believe this is going to continue while the other half believe not only are we going lower but they believe we will test the previous lows of 6,400 but may go lower.

I continue to use the 200 Day Moving Average as my major indicator right now as we are still below it on the Dow and S&P 500, but not on the Nasdaq. The Dow 200 day Moving average line crosses the axis now at 8,900. On the S&P 500, it crosses the axis at 942. The Nasdaq is slightly above its 200 day Moving average which crosses the axis at 1,725. We had closed yesterday at 1732. Watch this index pull back today or the next day or so and will be the clue that we will not go above the 200 day Moving Averages any time soon and it means we are closer to a pullback and correction!

One last thing Art Cashin said this morning and has been going on in my thoughts as well but hadn't heard it put that way of clarity until now. He said, There are a lot of cross currents going on right now and something, in essence, seems fishy. I have felt this too.

The market feels like it is being heavily manipulated to show an uptrend, as Volume is low. The only reason I can think of why this is going on is to try to build confidence by the public in the markets again. If this is what is going on, they should stop it as no one believes this stuff and it feels like a setup to get others to invest their remaining cash so someone can take it away again. Many of us don't believe this market rally is nothing more than a Bear market rally. There really isn't any good news out there yet.

The Put to Call ratio stays in a tight low range and closed yesterday at 0.78 while the VIX Index at 30.24 by days end. And not unrelated, Tim Geithner warned us yesterday of higher unemployment to come and more bad days ahead. As long as people are fearful of losing their jobs there will not be a recovery.

Labels: , , , , , , , , ,

Saturday, May 16, 2009

Market outlook for the week of May 18th, 2009


Back on April 10th, I made these comments for my Blog post that day regarding watching the price of Gold:

Gold has finally gone down as the market has gone up. On March 17th I said the following, "If Gold can get back below 900 watch the market move up more strongly. Gold is at 916 in pre-market. The low closing last week was 905. We were as low as 820 in January and I can see Gold pulling back significantly to these levels if news continues good."

As we now know from the 3 month chart above, after that statement on March 17th, Gold shares soared after the treasury decided to buy back Treasury notes, going to $952 before settling in back at the close Friday of 880. That is a significant pullback and shows the rally for the past 30 days is for real. Watch for moves up in Gold to signal a market reversal."


If you want to know where the market is going watch Gold, because as either inflation is going up or if people are more worried/scared, or manufacturing has sharply increased and is using more of the precious metal, Gold rises. Well this week we saw the Core CPI almost at zero so that indicator should not make Gold rise. Neither has manufacturing increased the use of Gold. But Gold did rise this week, closing at $932/ounce. The only reason is that people are more worried about where we are in the recovery of our financial system and the economy. Gold may go over the $952/ounce it had done back earlier.

The Dow closed this week at 8,269. This is down 305 points from the previous week's close of 8,574. The Nasdaq closed this week at 1680 and is down 59 points from the previous week's close of 1739. And the S&P 500 closed this week at 883 and is down 27 points from the previous week's close of 910. These declines although not steep were steady starting on Tuesday and continuing to the close Friday. When the market is in a declining phase low volume can chip away at these indexes for quite a while until the final surge to the lows and then reversal in trend. So as we look ahead, it is difficult to predict when this decline will stop and where it will stop.

The flood of newly issued shares by many of the Banks to raise capital sucked the wind and momentum of the uptrend rally in this market. More new shares should hit the market this week and next so I am pretty confident this downtrend will last for at least several weeks. My guess is that it will be gradual and possible as a zig-zag saw tooth pattern. You know those patterns as they are teasers. One day up a few points and then a day down of larger proportion. If you are wanting the market to go up it can be very frustrating to watch. However, if you have a sizable short position as I do, you can just let it play out and relax until it picks up steam and volume, because eventually one sells their position to take a profit. Timing is difficult during this pattern but if the focus is profit and not greed, it is a much easier trade.

The Put to Call ratio is also slowly rising but only very slowly as it closed yesterday at 0.80 and while it reached as high as 0.93 on Thursday intraday, it had a much lower range yesterday between 0.73 and 0.80. The VIX also remained subdued closing yesterday at 33.12, up 1.75 for the day, but well below the highs we had come to expect in the 40's and 50's when the market dropped back in early March. It still was a healthy 5.6% gain. It may be the more sensitive of the indicators to watch, in the coming weeks.

Look now at the 3 charts above. They are of all 3 Indexes, the Dow, Nasdaq and SP500. The red line is the 200 day Moving Average for each Index. If you look at the slope of that line, it is my belief that will be the rate of decline for the next few weeks. It looks to me almost predictable. So if you take the Dow, I would guess that we will be down testing the 8,000 level in the 2 weeks and on the Nasdaq we should be testing the 1600 level and on the S&P 500 we should be testing the 840 level again. Here, Jim Cramer of CNBC's Mad Money and I part ways, as he sees Tech stocks taking us higher. I see Tech stocks now leading us down as many take their profits from the lows. Besides, it is the closest Index to the 200 day Moving Average and is being pressed to go lower. Let's see if I'm correct. Stay tuned.

So I will continue to hold both TZA and FAZ and enjoy the ride. I think those on the Short side can go away and come back in a week.

Labels: , , , , , , , ,

Wednesday, May 13, 2009

Where's the stock market going next? Try wearing this story for size, down! (UPDATE)

I have not posted anything on the market since Saturday's post. In that piece I said the following, "The 200-day moving average is still trending downward. This tells me to hold off. It’s not yet time to jump back into the markets. This is not the time to buy & hold… not yet. Believe me, I’m watching this indicator closely." At that time the Dow was at 8,574 and the Nasdaq was at 1739. Today the market closed with the Dow at 8,285 and the Nasdaq closed at 1664. While the Dow dropped 185 points today, the volume was less than yesterdays. Same was true for the Nasdaq Composite Index volume. I would have liked to see a bit higher volume but it just means the drive lower will be slow and not fast.

TZA gained $3.67/share today to close at $30.84 for a 13.5% gain for the day. FAZ gained $0.75/share to close at $6.17 for a 13.9% gain. That was a nice recovery for both Triple Shorts. The Put to Call ratio closed today at 0.89, not anywhere near the extreme highs we had for the past year. There's plenty of room for it to go higher. I hope you now believe what I have maintained for a while through difficult times for Short positions. I know your question so here's the answer. The market should go lower, in my opinion. If you want to know the slope of the downtrend just look at the slope of the 200 day Moving average line for the Dow and the S&P 500. The Indexes should stay below the line. On the Dow, the line now crosses the axis a little below 9,000. On the S&P 500, the line crosses the axis at 950 and on the Nasdaq, it crosses the axis at 1735. It will be the Nasdaq Index to watch. Since we closed today at 1664 we are just below it and have stayed below it the past 5 days. Before that, we were above it for 3 days. So the pullback is being led by the Nasdaq. Watch that index during the day to get a sense if we are going to go above it and stay there. I just don't think that is going to happen any time soon.

Another piece of info I learned today was that when the top 19 largest U.S. banks were Stress Tests, the oversees branches of these banks were not included in the test. Considering Europe is in worse shape than the US, it seems that the Stress Test results most likely would have been worse. This would have meant much more money would need to be raised by each of the banks failing the tests. When I say that Europe is in worse shape consider this Spain currently has 17% Unemployment. And consider this, many of the banks requiring to raise Capital are doing it all at the same time. This will dry up money for new investments and cause additional pressure on the banking Index and on stocks in general. This all points to the market going down.

Let me answer another question you might have. Is it too late to get in on the Shorts like TZA and FAZ? Simply put, no!

UPDATE: 6:00AM PST

Looking for more clues as to market direction this morning and Gold is now at $925/ounce. It is still going up. I think Gold will continue to go up as the market pulls back. Unemployment claims for the week rose to 637,000, an increase of 32,000 from the previous week. This shows that we have not leveled off in unemployment as many had hoped. Continuing claims, also reported this morning, are at the highest level since 1950, 6.56 Million unemployed. One other number worth noting is the 3 Month LIBOR rate which is currently at 0.854, this is the lowest I have seen this number in many years. It is the rate Banks lend to each other.

Also, Asian markets sold off last night and European markets are mostly down this morning. While our Futures point to a neutral open, I believe we will go lower for the day. Art Cashin of UBS Warburg when asked this morning about market direction he said we need to hold the S&P500 at 870 or above. If we break through that level it's then 862 and if we break through that level we go to 820. Art also said it needed to be watched carefully as we go lower, because of the difficulty in predicting how low it is going to go.

Labels: , , , , , , , , , , , ,

Saturday, May 09, 2009

Put to Call ratio as a market Indicator


This morning I was doing some research and had a discovery that I wanted to share with my readers. It has to do with stock market indicators I track daily and what they mean to me. I am always open to hear other points of view on the same data so have at it if you like. The one I chose to focus on today was the much touted Put to Call ratio. Simply put, it is a ratio of the trading volume of put options to call options. It is used to gauge investor sentiment. For example, a high volume of puts compared to calls indicates a bearish sentiment in the market. I use the extremes of this indicator to help me determine market turning points and whether I should buy or sell stocks. In looking at the Put to Call ratio from 2004 to 2009, I discovered some interesting facts. First looking at the chart above, I have selected the most extreme values on the Index and plotted them as they occur over time on the Dow chart. You can see that most of the extreme point showed Bearish trends for most of 2007 and 2008, with the exception of a few low data extreme points such as 0.57 and 0.66. Most of the signals said to sell. You might want to double click on the chart to see it larger on a separate page.

The number of times the Put to Call ratio was at the highs of between 1.2 and 1.7 was 135 times out of 1400 data points. That's 9.6% of the time the sentiment was very pessimistic (Bearish). Interestingly, of those 135 times, here's the number of times by year:

2004 9
2005 9
2006 20
2007 33
2008 36
2009 0 (so far)

Here's a breakdown of these 36 signals by month for 2008
Jan 5
Feb 2
Mar 9
April 2
May 0
June 1
July 2
Aug 0
Sept 5
Oct 7
Nov 3
Dec 0

Remember it was Oct. 2008 that had the big drop from a Dow of 11,000 to about 7,800. The Put to Call ratio was screaming in March warning us of an impending drop in the market.

The number of times the Put to Call ratio was at the lows of between 0.69 to as low as 0.32, was 88 times out of 1400 data points. That's 6.3% of the time the sentiment was very optimistic (Bullish). Again, interestingly, of those 88 times, here's the number of times by year:

2004 51
2005 13
2006 15
2007 2
2008 0*
2009 6

* Notice that there were 0 Bullish signals in 2008 and also notice that for only the first 4 months of 2009 there has been 6 Bullish signals. It may be we are in line for about 18 for the year at this rate.

Here's what the Dow did in each of those years starting with the first number the opening price in January and the second number the December ending.

2004 10,425 10,800
2005 10,800 10,796
2006 10,796 12,500
2007 12,500 13,264
2008 13,264 8,483
2009 8,483 8,574 Closing price on May 8th

It is clear from the above data that there were many signals to sell and prevent the loss of capital by watching this Put to Call Indicator. The difficulty with using any single indicator to make a market decision is that you don't know if you are in a transition period within that indicator or not. So using the highs and lows as determination points can be misleading and costly, as I can tell you first hand. I don't use a single indicator, but try to use several. I happen to like this one but trends are more important as you can see from the above data, than isolated data points.

If any of you were recipients of my Newsletter and can remember back in 2000, I had used the indicator at its extreme to tell my readers I was going into 100% cash at that time because the extreme reading on the Put to Call ratio was at the most Bullish signal at 0.30. That extreme value of Bullishness could be a great tool to find a turning point while everyone is buying and selling into the rally. Conversely, when the Put to call ratio was at the extreme pessimistic value after 9/11, I used it to Buy back into the market, as did many others. So the take away is this from the Put to Call ratio, when the numbers start showing consistently a high or low value, believe the trend. If the numbers are staying low, it is a bullish sign and the market should rally. If the numbers are pointing higher, it is a bearish sign and the market will drop. However at both extremes they will reverse that trend.

Lately the market is signaling a Bullish, not bearish trend with the Put to Call closing on Friday at 0.86 and it has been as low os 0.65 recently (May 5th). We are close to testing this rally as we approach the 200 day Moving averages for the Dow and S&P 500. We have gone over the 200 day Moving average on the Nasdaq this past week but retreated below it. This next week is an important week. If I just use the Put to Call ratio as an indicator, it says the market will go higher. But if I consider the 200 day Moving average it gives me pause and has been the reason I have not sold my ETF Ultra Short, TZA. It has been painful to hold on to the shares given the big drop from about $31-$36/share purchase price to the close yesterday at $25/share. Luckily, my shares of other stocks like BCON rose significantly lately to minimize the paper loss. Here's an excerpt from the Dynamic Wealth Report on the 200 day Moving average from Feb 23rd, 2009 and is applicable today:

The 200-day moving average is still trending downward. This tells me to hold off. It’s not yet time to jump back into the markets. This is not the time to buy & hold… not yet. Believe me, I’m watching this indicator closely.

Once we start trending higher, it’ll be time to get reinvested in the markets - in a big way. Until then, continue hedging your positions… buy stocks very selectively, and stick to the strength of the markets. If you do decide to take positions, make them small… it’s a traders market right now.


One other piece of data I am watching is Insider trading. Insider Selling dollars amounts dominate the Buying and has for many months. If things are really go up a lot, someone should tell the Insiders, because they don't seem to think so!
Good luck this week. Don't forget to vote for May on my Mini Poll as to when you believe the recession will end.

Labels: , , , , , , ,

Friday, May 08, 2009

The Financial crisis: Toxic Assets or Bargains?

The Stress Test results from Banks yesterday proved one thing to me, these toxic assets may not really be as bad as everyone has claimed they are. How else could the Banks pass the Stress Tests yesterday for the most part. It wouldn't make sense unless these tests were a farce. I just can't believe that the best minds devised a test that was meaningless. Could it have been flawed for our benefit? Positively, it could have been. But with the whole world watching, I doubt it.

That means that the recent purchases of foreclosed homes by bargain hunters may have staved off a more precipitous drop in housing prices. The additional benefits from the Treasury and Fed coordination of the lowest interest rates in years have given some the bargain of their lifetime.

I have been wondering why the stock market hasn't been beaten up even more than it had. And I was also wondering why it has gained so much recently and why does this crisis not resemble the 1930's stock market crash. Well, like it or not, I believe we are moving at a pace so much faster than those of the 1929 Stock market crash and the following years of the Great Depression. In my view it is all because of Technology and the Internet. Communications happens now 24/7 where back then many didn't realize what had happened until it was affecting them directly or their neighbors. I am reminded for the rapidity of information regarding our recent scare over the Swine Flu. But the messages by the media to cover your mouth when you cough, to wash your hands throughly, may have helped ease this illness in ways we can't imagine.

With instant communications and the instant gratification this generation has come to expect, we all want to be over with this and move on with our lives. Yes many got very scared and drove to protect themselves financially, but many others are apparently over the crisis and as long as they are employed, they see enough signs to suggest they can get back to their old ways. Whether this bears out, only time will tell. One thing seems certain, these toxic assets appear to have been undervalued and since most of them are based upon real estate, there may be some terrific bargains out there. What attracts me to that idea is that real estate is a hard asset. And if we are on the path to recovery as many believe, then inflation must be around the corner from all the cash infused to save the banks and the financial system.

How has this affected my thinking about the stock market? Well we should be able to see very soon whether we are going to recover back to the Dow 10,000 and above by watching the 200 day Moving Average line. If we can get above the 200 day Moving average on Indexes like the Dow, S&P 500 and the Nasdaq Composite Index, we may recover much more quickly than many are expecting. The 200 Day Moving average on the Dow, crosses the axis at exactly 9,000 today. It crosses the S&P 500 at 957 and it crosses the Nasdaq Composite Index at 1740. We have been over the 200 day MA on the nasdaq the past 2 out of 3 days. The Dow bear market that started on September 3rd, 1929. didn't make it back to its highs until 1954!! The Dow closed yesterday at 8,409 and the S&P 500 closed at 907.

I have a hunch that this time it will be much quicker. We may look back at this time in 10 years and wonder why we acted either so afraid we missed a once in a life time opportunity or were so confident we took advantage of this situation. To me this infers you must be nimble and question yourself and your actions daily, in the face of new information and ever changing circumstances.

UPDATE:

News just out: The unemployment rate just came out for April and it is now 8.9% nationally, up from 8.5% in March. I had expected 9.0% or over.

Labels: , , , , , ,

Thursday, May 07, 2009

Market Outlook for May 7th and the near term (UPDATE)

It is feeling to me this rally is going to continue. When you add some apparent news on Retail, which is better than expected, and you have a real rally going on. I knew this rally was going to be for real, but I didn't know it was going to be so steady and strong, even on less volume. All my indicators show a continuation of this trend, as there doesn't seem to be bad news enough for the pullback I anticipated. But heck, maybe that is the exact moment when things are too optimistic. :)

The Put to Call ratio closed yesterday at 0.77 and the VIX Index closed at 32.45, which is thew lowest it has been since September, the beginning of the Sub Prime impact on markets. Yesterdays Volume for Dow and Nasdaq stocks hasn't been this high since April 20th. So the gain yesterday was convincing, at least to me. The Nasdaq Composite Index did end the day with a Hammer Candlestick pattern suggesting this is the end on the move up for that Index. The Dow ended the day with a Doji Cross pattern, suggesting a draw in the contest between Bulls and Bears.

There is an expression my Uncle uses in times like this, "don't fight the tape". I think it is appropriate at this juncture of the market, and I did fight it all the way. I should sometime listen to my own advice which I made about this rally back in mid March, this rally is for real and many may regret not having stocks in their portfolio becasue there will be some good gains."

FAZ shows a clear confirmation of a Sell Confirmed signal at the close yesterday by AmericanBull.com, so I may sell my few shares in it today. Regarding my shares of TZA, currently at $26.12/share, AmericanBull.com suggests a Buy If signal at the close yesterday. I am going to continue to hold these shares and may buy more to average down my costs on the shares. The market will eventually pull back and we are closer to the top of the range now, not the bottom, with the Dow closing yesterday at 8,567. I had said the top of this range is 9,200 and the bottom of this range is 7,300, so we are clearly nearer the top. The 200 day Moving Average crosses the Dow now at 9,000, so I do not see us going over this level.

When you compare where we are now, relative to 9,000, we are set for a pullback very soon. So I am holding on to my TZA shares and may take some profits now on some recent gainers and not try to time the top. This rally is not a call to Buy and Hold, but to trade it. These markets will not return to Dow 10,000 any time soon. So trading for profit is the only wise play going forward. If you can't do that, better keep your assets in cash.

UPDATE: 9:30am PST

It looks like the Nasdaq hammer Candlestick pattern was correct, the market has pulled back. Volume on both the Nasdaq and Dow are ahead of yesterday's good volume, so this downside move has more to go and may start a real reversal in trend. Gold is up to $914/ounce.

Labels: , , , , , , , , , , ,

Technorati Profile