Tuesday, June 29, 2010

Market outlook June 29th

Did you miss me? I took a few days respite from writing about the stock market. But here I am again. Consumer Confidence numbers just came out a few minutes ago and it wasn't good. The June Consumer Confidence came in at 52.9 versus a May reading of 62.7, which is a huge drop. Stock markets around the world are down this morning triggered by revisions downward in China of their economic data. The Dow has dropped below 10,000 and as low as 9,889. Currently it is sitting at 9,914. That's about a 200 point drop. The Nasdaq is down 66 points to 2154 and the S&P 500 dropped to 1048 down 26 points. All of these Indexes have dropped below their Intraday lowest Support levels.

It is still too early to tell from the chart above, whether the market will go lower or bounce up on technicals, but if I were a betting man, and I am, I would say we are going lower today and setting up a very bad Unemployment report due out Friday as we go into July.

You can't say that I haven't given plenty notice here that this was coming. And remember, this is just the beginning of a very painful decline. Cash will be King, so make sure you are raising Cash.

TZA Options are rising very nicely today as the stock also fairs well on this decline.

UPDATE: 7:55am PST

The Intraday chart has formed a very steep slanting downward "W" pattern. This suggests to me we have not hit the low of the day today. Keep checking back.

Update: 4:00pm PST

The markets closed earlier today and I was not surprised as we did go lower as I sated we would in my earlier comments above. As you can see in the full Intraday chart of the Dow, the low today was 9,811 but closed at 9,870. If you will notice the second red line I drew under the last "W" pattern near the close, it shows the "W" slanting down. I interpret this to mean we will most likely start down tomorrow and hit a lower low. We could test 9,800 tomorrow. We are at the low of June 8th again and most likely this level will not hold.

Labels: , , , , , ,

Monday, June 28, 2010

Paul Krugman sees Depression is inevitable

I am taking the unusual step to add here the Op Ed piece of Paul Krugman writing in the NY Times. I have been telling my readers we are headed for a big drop in the markets of cataclysmic proportions. Now Paul Krugman uses the word DEPRESSION in his article, not as a passing comment about the 1930's, but rather, where we are headed. Here are his own words:

OP-ED Ccolunist
The Third Depression
By PAUL KRUGMAN
Published: June 27, 2010

Recessions are common; depressions are rare. As far as I can tell, there were only two eras in economic history that were widely described as “depressions” at the time: the years of deflation and instability that followed the Panic of 1873 and the years of mass unemployment that followed the financial crisis of 1929-31.

Neither the Long Depression of the 19th century nor the Great Depression of the 20th was an era of nonstop decline — on the contrary, both included periods when the economy grew. But these episodes of improvement were never enough to undo the damage from the initial slump, and were followed by relapses.

We are now, I fear, in the early stages of a third depression. It will probably look more like the Long Depression than the much more severe Great Depression. But the cost — to the world economy and, above all, to the millions of lives blighted by the absence of jobs — will nonetheless be immense.

And this third depression will be primarily a failure of policy. Around the world — most recently at last weekend’s deeply discouraging G-20 meeting — governments are obsessing about inflation when the real threat is deflation, preaching the need for belt-tightening when the real problem is inadequate spending.

In 2008 and 2009, it seemed as if we might have learned from history. Unlike their predecessors, who raised interest rates in the face of financial crisis, the current leaders of the Federal Reserve and the European Central Bank slashed rates and moved to support credit markets. Unlike governments of the past, which tried to balance budgets in the face of a plunging economy, today’s governments allowed deficits to rise. And better policies helped the world avoid complete collapse: the recession brought on by the financial crisis arguably ended last summer.

But future historians will tell us that this wasn’t the end of the third depression, just as the business upturn that began in 1933 wasn’t the end of the Great Depression. After all, unemployment — especially long-term unemployment — remains at levels that would have been considered catastrophic not long ago, and shows no sign of coming down rapidly. And both the United States and Europe are well on their way toward Japan-style deflationary traps.

In the face of this grim picture, you might have expected policy makers to realize that they haven’t yet done enough to promote recovery. But no: over the last few months there has been a stunning resurgence of hard-money and balanced-budget orthodoxy.

As far as rhetoric is concerned, the revival of the old-time religion is most evident in Europe, where officials seem to be getting their talking points from the collected speeches of Herbert Hoover, up to and including the claim that raising taxes and cutting spending will actually expand the economy, by improving business confidence. As a practical matter, however, America isn’t doing much better. The Fed seems aware of the deflationary risks — but what it proposes to do about these risks is, well, nothing. The Obama administration understands the dangers of premature fiscal austerity — but because Republicans and conservative Democrats in Congress won’t authorize additional aid to state governments, that austerity is coming anyway, in the form of budget cuts at the state and local levels.

Why the wrong turn in policy? The hard-liners often invoke the troubles facing Greece and other nations around the edges of Europe to justify their actions. And it’s true that bond investors have turned on governments with intractable deficits. But there is no evidence that short-run fiscal austerity in the face of a depressed economy reassures investors. On the contrary: Greece has agreed to harsh austerity, only to find its risk spreads growing ever wider; Ireland has imposed savage cuts in public spending, only to be treated by the markets as a worse risk than Spain, which has been far more reluctant to take the hard-liners’ medicine.

It’s almost as if the financial markets understand what policy makers seemingly don’t: that while long-term fiscal responsibility is important, slashing spending in the midst of a depression, which deepens that depression and paves the way for deflation, is actually self-defeating.

So I don’t think this is really about Greece, or indeed about any realistic appreciation of the tradeoffs between deficits and jobs. It is, instead, the victory of an orthodoxy that has little to do with rational analysis, whose main tenet is that imposing suffering on other people is how you show leadership in tough times.

And who will pay the price for this triumph of orthodoxy? The answer is, tens of millions of unemployed workers, many of whom will go jobless for years, and some of whom will never work again.

A version of this op-ed appeared in print on June 28, 2010, on page A19 of the New York edition.

Labels: , , ,

Saturday, June 26, 2010

An Open Letter to President Obama and Senate Democrats.


I feel enraged at the lack of compassion the Republicans in the Senate have for the unemployed needing a hand in the form of unemployment benefits which have run out. Yet, these same Republican Senators passed every request by the Bush Administration, without providing the funds for them, including the lack of funding of both the Iraq and Afghanistan wars, unfunded Medicare benefits which they approved, as well as unfunded requirements from the No Child Left Behind legislation they also approved.

They want government destroyed by weighing it down with debt, while they blame Democrats under the Obama presidency for the debt problem. I am outraged that Republican voters allow them to get away with it. Is there no moral compass, where voters know the difference between right and wrong, moral and immoral behavior? The Republican Party used to be a great party. I have voted Republican in earlier years of my life. But the crazies have taken it over and pulled them so far right they are now extreme at their very center. It has caused the Democrats to also go more right and the Progressives are wondering where is the Barack Obama they elected?

The problem has been compounded only because President Obama and the elected Democrats in the Senate have tried to be "bipartisan". This is a character flaw of the leadership and of President Obama. I can forgive them for this up to now. Maybe President Obama needed sufficient data to convince him that the Republicans are serious in their pursuit to defeat him and Democrats. Maybe he needed more data to convince him that they would accept him eventually as President, being half black. Maybe he needed more data to be convinced it was just politics and not a grab for power. He was wrong. It has been a systematic war the Republican leadership has been waging. There has not been one single Republican vote to support your legislation. Isn't that enough data?

It's time, Mr. President and Senator Reid. It's time to get this. It is as real a war as was Iraq and Afghanistan is with its own type of IEDs (Improvised Explosive Devices). These IEDs are placed in front of all legislation that you propose. It is called by a special name, the filibuster. It's time to play war too! It's time to change the Senate Rules and get the agenda passed you were elected to pass. It's time to take the gloves off and put a steel rod in that spine of yours and stand tall. You don't have much time left before you lose the people that got you elected, Mr. President and Sen. Reed. Change the Rules on the Filibuster and let them see you have the spine to do what they had threatened you with, when they were in power during the eight years of Bush/Cheney. It's time for that so called "Nuclear Option", ending the filibuster as we know it. 41 Republican Senators have held this country hostage over the will of most of the population of this country, as 57 Democratic Senators have voted for the will of the American people.

You haven't lost the middle because of the Republican tactics; you've lost more of the Independents because you haven't stood tall enough to keep their respect. You haven't shown them you deserve their support. You have turned the other cheek instead of metaphorically slapping their face. Mr. President, you can change the way Washington behaves, but first you must lead like you want people to follow. YOU must change your style and your tactics. So must Senator Reid.

So far, it isn't working like it should at this point in your Presidency. But you have had a moment of leadership with General McChrystal being removed from duty. And while I'm at it, you need to have another moment of leadership in the Gulf Oil Spill Cleanup. Admiral Thad Allan is a good guy, but he doesn't give the confidence of a "command and control" guy, like General Schwarzkopf has. Get a strong leader to seize control of this mess in no uncertain terms. We are at war in the Gulf too Mr. President. Don't make the error of trying to lead this yourself. You need someone else who has total authority to do what is necessary and understands logistics and has the skill set to manage this catastrophe. I recommend General Schwarzkopf. Now is time to lead!!!! God help us if you don't.

Update: I sent a first person email to the President at the White House with this letter.

Labels: , , , , , , , , , , ,

Friday, June 25, 2010

Market Outlook June 25th

GDP was revised downward for the first quarter, from 3.0% to 2.7%. Financial regulation was passed and the initial reaction was that Bank stocks rose about 1 to 2%. Is this tough reform? No, most will agree. But why not? Mainly because Republicans continue to filibuster everything proposed by the Obama Administration. They don't want Financial regulation and the industry has bought the Congress and the Senate. They have lobbied so much and got their way. this Bill does not have the teeth that would keep us from being vulnerable to shenanigans of Wall St. again. What will it take to stop Wall St.? Something they can't control, a market Crash and a Depression. That is where I believe we keep marching towards. We are destined to repeat history's lessons we seem not to have learned.

I have some friends on Wall St. and the rank and file employees say they want tough Financial regulations but their bosses are addicted to the obscene salaries they give themselves. It reenforces the saying, "power corrupts but absolute power corrupts absolutely!" I guess it is the negative part of being human.

Even though Futures had looked positive after the news was announced on Financial regulation being approved, the markets opened slightly up but then turned negative and is where they are now. We are headed lower and lower, each day like a trickle. Nothing alarming to cause a panic, but a steady erosion of prices, as despair creeps into the markets. The Republicans in the Senate are united and for 8 consecutive weeks don't seem to want to help extending the benefits of the Unemployed. They continue to Filibuster them getting an extension in unemployment benefits. That's well over 1 Million people will not get any money after June 30th. Watch them lose their homes and continue to increase this decline to an eventual Crash.

I had a personal experience growing up around this issue. My Dad worked as a Tailor in the garment business back in the 1940's. He made Men's suits and Top Coats. He worked very hard in the Spring and Summer in a sweat shop with temperatures reaching in the upper 90's and low 100's because of the Steam presses. That is the reason they called it sweat shops. Well when September came, my Dad would be laid off and he would have to go collect unemployment benefits as there was no work for a tailor. I used to go to the Unemployment office and stand in line with him. Thank God for those benefits as I don't know how we would have had money to pay the rent or buy food. It wasn't charity, as everyone had to pay part of their income for Insurance so there was money to pay them when they were laid off. So it was money earned and set aside for them when they were let go from their jobs.

So when I see Republicans not wanting to approve benefits for those unemployed, not because of anything they did, but what the wealthy cats on Wall St. created by gaming the financial system for their own benefit, I get real angry. And yet, these same Republican Senators are trying to get tax breaks for the top 100 wealthiest of us in this country. This is immoral. We deserve a Crash as it is the only way even they will get hurt. It levels the playing field, cleans the gene pool a bit, and teaches a lesson to those who have to understand the plight of those who not only don't have but have never had but crumbs. As Americans, we get the government we deserve, because we don't step up and insist on better leadership, no matter if they are Republicans or Democrats or Teabaggers or Independents. It's hard to just blame "them", when we vote for "them"!

Well the market had gone down 13 when I had started to write this and now is up 17 as I finish it. Remember the overall trend will be down with some spurts up but a steady decline when you look at the charts. First we will break below 10,000 on the Dow in the coming days and then below 9,800 in weeks and then below 9,500 and then the Fall we see us testing 9,000 or lower. Drip, drip, drip! We are in a Bear Market!

Here are some headlines which should give you pause. Click on each to go to the story:
States of Crisis for 46 Governments Facing Greek-Style Deficits

Banks ‘Dodged a Bullet’ as U.S. Congress Dilutes Trading Rules

Economy in U.S. Expands 2.7%, Less Than Forecast

Leaders differ on how to nurture a global recovery

U.S. Durable Goods Orders Crash With Aircraft


Now the Dow is down 22 points and forming a "W" pattern as the chart above shows. This means we are headed lower today. Come back for Updates during the day!

Update: 7:45am PST

I just learned that the Russell 2000 is going to be rebalanced today. Some stocks added and some taken out of the Index. What effect this will have on TZA will be negative as when they rebalance they are trying to improve the Index quality and this means that TZA will go down while the Russell goes up somewhat. That is why all the other major indexes are down but the Russell is up right now. It's not by a lot, but it explains the discrepancy. This rebalancing will create only a temporary rise of the index. Eventually all stocks and all Indexes will be going lower. It's just a matter of time, but time is what Options are all about, aren't they! I think October TZA Calls will be OK, but July ones may be affected negatively and not recover in time.

Update: 8:10am PST

We have formed 2 "W" patterns and both slant lower. Even if the market rally's somewhat from these levels to me there is a 90% chance the Dow will go lower today to complete this lower slant. Time will tell.

Update: 9:30am

We have not yet satisfied that 2nd red line "W" pattern yet, as shown in the chart above. In fact, we have formed a 3rd pattern and it is slanting up. I still believe we will go to a new low before the close today. This is not a certainty as about 10% of the times it does not follow what is expected. But I am going to stick my neck out here and say I think it wil go back to the low today, especially going into the weekend, where a storm is brewing in the Gulf and threatens Oil recovery efforts. The low of the day coincides closely with S1 for the Dow, which is at 10,088.

Update: 10:35am PST

The Dow has moved up now but the Russell 2000 is soaring because of Rebalancing and the window dressing the big boys are doing at the end of the Quarter and 6 months into the year. Also, TZA is going to have a reverse split next week. This is affecting the Russell and the price of TZA which is now below $7.00/share. I can't predict what this will do for the Options except it ads another level of uncertainty to things.

Labels: , , , , , , , , ,

Thursday, June 24, 2010

Market outlook: June 24th with Updates

This morning's economic data has been reported. First, May Durable Goods orders were down -1.1% for May. It was up over 3% in April. This is the first month it has been down in 9 months. Then Jobless Claims were reported down to 457,000 from 476,000, a drop of only 19,000 claims. But that could be because Congress did not pass extending Unemployment benefits for the long term unemployed. So I wouldn't be feeling better over the smaller number quite yet. Of course they haven;t mentioned that in the numbers or the media because they don't want you to be feeling anything but good right now. It's called manipulation. Have you ever asked yourself this, If the economy is truly doing better wouldn't we be feeling that and there wouldn't be a need to manipulate us? Hmmmmm.

Moving on, Futures are pointing to a lower opening. The Dow is down about 35 points, the Nasdaq is down about 14 points, so we shall see how this day unfolds together.

The chart patterns for the Dow, S&P, Nasdaq and Russell, according to ElliottWave Forecast web site, shows Bearish outlook for the Short term (Weeks to a Month), Medium term (1 to 6 months) and Long term (6 Months to a year). This is the first time all three periods have been Bearish.

Remember those Support levels going into today. For the Dow, that shows S1 at 10,227 and S2 at 10,157. Yesterday's close was 10,298. On the upside, R1 Resistance is at 10,368 and R2 is at 10,438. I don't see us going back this high, I am more concerned about breaking below the Support levels for those still holding stocks in hopes of a turnaround. For the Russell 2000 Index, S1 is at 637 and S2 is at 631. This Index closed yesterday at 644.

Those holding Put Options on stocks or Indexes can relax right now, as when the market drops, they make money. Same is true for my TZA Call Options, as they should rise with the Russell 2000 dropping, because they are based upon this Triple ETF Ultra Short. In pre-market, TZA is up 3% with the Russell Index Futures down.

Update: 8:00am PST

As you can see from the Intraday chart above, the Dow has dropped about 110 points so far this morning. As I say that, I can see the W pattern being formed and most certainly this next leg down will go below these low levels. Watch S2 support level for the Dow as that would take us down 150 or more points in total.

Update: 12:15pm PST.

We went below S2 on the Dow and are now down about 152 points at 10,140. We still have 45 minutes to go but I believe we are going even lower in the remaining time. I do not want the market to close at the bottom today so hopeful;y it won't as it would form a Hammer pattern and that would indicate a reversal is coming and the market would go up. However, it would be inconsistent with the news out there for the market to rise. It needs to go down and we all know it, the quicker the better. As you can see there is a very steep "W" pattern pointing almost straight down to contend with here. We have now hit a new low today of 10,132.

Labels: , , , , ,

Wednesday, June 23, 2010

Why the Nasdaq isn't tracking the S&P 500 and the Dow this past year.

I wrote on Tuesday, June 21st, that the Nasdaq has not followed the other Indexes in terms of the slant of the "W" pattern and it was slanting up, rather than down like the other Indexes for the same time period. I didn't understand why as it didn't make sense. I even proposed a scenario that said the Nasdaq might drop more than the other indexes to correct this discrepancy. However, today an article in Seeking Alpha reports the fact that Apple, Inc. now represents 20% of the Nasdaq 100, which might have a similar impact on the Nasdaq Index and account for the discrepancy. It could be that when markets drop it might be that Apple will be hit more than the other stocks. Remember that when the market was testing Dow 6,400, Apple stock was at $76/share. It is now 270/share. Here's the article by Bespoke Investment Group:

"With shares of Apple (AAPL) rallying even as the overall market remains weak, the stock's weighting in the NASDAQ 100 is beginning to make a mockery of the index. Believe it or not, AAPL now has a 20% weighting in the index. No, not even AAPL has rallied so much that its market cap actually accounts for 20% of the NASDAQ 100's market cap (although it does currently have the highest market cap in the index). The reason for the large weighting dates back to the creation of the index when the market cap of Microsoft (MSFT) dwarfed the rest of the stocks listed on the NASDAQ. Back then, in order to avoid making the NASDAQ 100 an index dominated by MSFT, they had to arbitrarily lower MSFT's weighting and raise the weighting of the rest of the stocks in the index.

Today, the NASDAQ 100 is increasingly becoming an index of Apple (AAPL). At current levels, AAPL's weight in the index equals the combined weight of MSFT, GOOG, QCOM, ORCL, CSCO, and INTC! Given that MSFT's weight was once adjusted so that it didn't dominate the entire index, some would say that it's time for the NASDAQ to adjust the weightings again so that AAPL doesn't dominate the index now. However, according to NASDAQ's methodology (pdf) for the index, AAPL's weighting in the index won't be up for review until its weight reaches 24% of the index or more."


Now that makes sense as to why the Nasdaq has not performed similarly as the DOW or S&P 500 Index as well as the Russell 2000 Index. Let's see what actually happens.

Labels: , , , ,

Tuesday, June 22, 2010


Summarizing where we are in the stock market after the close on Tuesday, new Support levels have been determined because of the 150 point drop on the Dow today. S2 (Second level Support) is now at 10,278 and S1 (First level Support) is at 10,360. Clearly we went through several previous levels of support and the Dow is poised to drop in coming days.

For the Russell 2000, S2 is at 652 and S1 is at 644. The Russell closed today at 646 down 14.12 or
-2.14%. Since TZA is a 3x ETF Ultra Short of the movement of the Russell, it closed at $7.00, up $0.44 or 6.71% today. I expect these shares to continue to rise and the Call Options for October and January to continue to rise. R2 (Second level Resistance) for TZA is at $7.08 as we already went above R1 which was at $6.17/share. We most likely will go above this level possibly tomorrow.

Those of you who have been following my site now know how to identify and analyze these "W" patterns which foretell of the next most likely direction of the market. In the 6 month chart above, I have identified the overall "W" pattern, you can see it slants downward as indicated by the Red line under the "W" pattern. This usually means this Index will most likely go lower than the bottom of the second bottom point of the "W". This same pattern is evident in the S&P 500 Index and also the Russell 2000. The Nasdaq index has the same pattern but the "W" slants upward, meaning this Index should go up. However this seems inconsistent and will need to be resolved over time. One scenario might be that a single stock drops significantly driving the Nasdaq down greater than the other Indexes and thus resolves the discrepancy. This could happen during earnings season which starts in a few weeks.

The Fed speaks Wednesday on Interest rates. Don't expect any new news but in spite of that watch for a market reaction. Things are not tightening by the Fed because we are in Deflation, not Inflation!

Labels: , , , , , ,

Market outlook June 22nd


Existing Home Sales were down 2.2% for May. This was lower than analysts expected and is not a good number. The stock market is near neutral this morning and making up its mind where it is headed. The Dow has had a 90 point range this morning going as high as 10,493, but has pilled back after the release of the Housing data. They are talking that this may be the beginning of a double dip in the recession. The Dow is now down 5 points but heading up again to the positive. I will post intraday charts of the Dow and make commentary throughout the day. But there is a tug of war to define market direction between the Bulls and the Bears. Check back, as a "W" pattern is being formed.

Update: 8:45am PST

The Dow and other indexes have been between positive and negative values today. Two "W" patterns emerged as is shown on the above chart. The first one I did not put a red line under, but it was not slanted and just before the one I did underline in Red. It seems like the market is trying to go up now as the slant indicates. I am not buying or selling today, as direction seems to be unclear today. And when I am in doubt, I go back to the question, What is the overall Trend of the market? The answer is down. So I do not buy when short term direction is unclear. Stay tuned for more updates.

Update: 11:30am PST

As you can see from the last "W" pattern above we are going lower than this last leg down on the "W" pattern. TZA Calls should be rising. Remember 10,393 on the Dow is at the S2 support level. For those long the market, you will want this level to hold. For those short, you will want this to go lower than 10,393 and stay below that level.

Update Noon PST

As you can see the market did follow the slanted "W" red line and went down over 100 points and broke through all Support levels. This market does have a negative bias and today just proves my point. Direction had been slightly positive and then negative teetering art the Unchanged line, but then made up its mind that the Bears are in control. We are in the last hour of trading so let's see what happens as there are no "W: patterns to get a clue from right now.

Update: 1:15pm

The market has closed and the Dow finished at 10,293, down about 150 points today. More interestingly, the Dow finished today below its 200 day Moving average which is at about 10,320. THE DOW MANAGED TO STAY ABOVE THE 200 DAY MOVING AVERAGE FOR 5 OUT OF THE 6 DAYS. Unfortunately for the Bulls, it has closed below that level and will make a rally above face more resistance. As can be seen in the 2 month chart of the Dow above, it has been down below the 200 day Moving Average from May 20th until June 15th, so this is a setback for the Longs. For the Shorts like myself, it is what I had expected. I did not sell any TZA Calls (which is the Triple ETF Ultra Short with goes inverted to what the Russell 2000 is doing. If the Russell drops 1% TZA goes up 3%.) TZA closed today just shy of $7.00/share for a 6.3% gain. Volume today was slightly ahead of yesterday's but is not that low low given it's the beginning of summer and many are on vacation this week as school is out. Check back tomorrow and every week day for market updates and on the weekends occasional commentary on the news of the day. Thanks!

Labels: , , ,

Monday, June 21, 2010

Monday June 21st Stock Market outlook (with Updates)


They say big news is driving the markets around the world today and that is China's currency move, the Yuan. It has been allowed to move and it means a short rally in stocks. However, it means the Dollar will be hit again and it will cost more for the US to pay its debt.

Merideth Whitney was on CNBC earlier this morning and stated unequivocally that the Housing market is in for a double dip down. She said she sees the 2nd half of the year as trouble for earnings and markets and the beginning of another leg down in housing prices. She said there are a lot of rotting assets on Bank books too and that Banks have tightened credit availability for Consumers. Not a good thing for Small Businesses.

So I see a short Rally ensuing today and approaching the earlier high target I had set for the Dow at 10,600. That will form the right shoulder of the "W" pattern in this 1 year Dow Chart. Then we will head down again, as you notice that the "W" pattern is slanted down on this chart. It turns out that 10,600 is where the Dow 50 day Moving average crosses the axis. This next drop should coincide with the earnings season which starts around July 12th with Alcoa. Please notice that with the exception of Friday's Volume of Options Expiration day, the volume in this rally up has been at the expense of lower volume than the drop to the low. Low Volume and rising prices are very bearish so don't get caught up in the hype this is the time to get back into the market. I don't believe a word of it.

I will not sell my shorts, but instead add to my positions at these cheaper prices. Stay calm and be patient is my motto, as nothing has really changed in the world to be optimistic about. The currency move by China prevented a Trade war which was brewing because Congress was playing tough on the issue with much antagonistic language towards China. I will update this post as the day unfolds so come back.

Update: 9:30am PST

As you can see from the chart above, the market had a nice open and then has been sliding continually. As I have shown with the Red line under the latest "W" pattern, it is sloping down and therefore the market will continue down until another new pattern emerges. I hope you took some profits this morning as the Dow has hit a high today of 10,594, which is pretty close to my Dow 10,600 prediction. We are going to test the previous resistance levels which is at 10,512. So as the market drops down to this level we will see if it holds or goes lower. The next level the market will go to will be to test the lower level of 10,481, if we don't hold at 10,512.

Update 1:10pm PST

The Dow did drop as predicted and the market closed negative in all 3 indexes, the Dow, S&P 500 and the Nasdaq. Hope you took profits early in the day as I recommended earlier. Also it was a great time to buy more TZA Calls and Puts on selective stocks. The Dow finished at 10,442 clearly breaking below previous Resistance levels and is now around the Pivot Point of 10,452. Support is at 10,422 and S2 is at 10,393 so watch these levels the next day or two.,

In trying to decide what to do each day, I keep in mind that the mood of investors is bearish, not bullish and the charts reinforce this view as I have shown on earlier posts. From a long term perspective, we are forming the right shoulder of a Head and Shoulder pattern, or "W" pattern as I like to call them for short, which is 30 years in the making. See previous posts showing this chart of the Dow and make up your own mind. See you here tomorrow!

Labels: , , , , , , ,

Friday, June 18, 2010

Not being serious enough on the Gulf Oil Spill Cleanup: President Obama disappoints again.


On Wednesday I had posted another promotion regarding who should be in charge of the Gulf Oil Cleanup. I had suggested 2 people. The first was General Schwarzkopfp, leader in the Gulf War. The second was Lt. General Honore, who was a lead in Hurricane Katrina efforts. So this morning we learn President Obama picked neither. In fact he is picking a part-timer to head up the effort. From Yahoo news this morning, this: "Navy Secretary Ray Mabus, who oversees 900,000 Navy and Marine personnel, is inheriting an amorphous second job as the Obama administration's leader of long-term environmental and economic planning. His task is no less than rebuilding a region still suffering after Hurricane Katrina and beset by decades of environmental problems."

This doesn't look like War on the Gulf Oil spill at all. Geez, common Mr. President. Can't you do better than that? Sadly to say, I guess not.

Labels: , , , , , ,

Thursday, June 17, 2010

CPI went negative again and Jobless Claims rose. Everything is just Peachy isn't it?

Reported by Bloomberg.com this morning, "The cost of living in the U.S. dropped in May for a second month, signaling the world’s largest economy is recovering without causing prices to flare." Now isn't that a cute way to describe deflation, "it didn't cause prices to flare"! Give me a break! What spin.

They also reported on Jobless Claims the following, "The Labor Department also reported today that initial jobless claims rose 12,000 last week to 472,000. Economists surveyed by Bloomberg had forecast a decline to 450,000, according to the median estimate." Hmm, off again these economists by a bunch! Are these the people we are relying on to tell us we are recovering. Wake up, we're not recovering. Ask any tradesman in your community how business is going for them. We had to hire a Dry Wall repair person. He said not much work for any Tradesmen because New Home Construction is non existent. He knows Electricians who have taken to drive a truck to get any work. He quipped, "Maybe we are being affected by the Gulf Oil Spill and can put in a Claim before we are homeless from the lack of work.

Friends, things are not really good in Camelot. But it's easier to think it is than to face the fact it isn't. I don't blame people for wanting hope. Today is Options expiration for June. I think the volatility will not emerge today as many shorts have covered over the past week or so causing this temporary rally. If there is anything to report today, I will add an update to this post. Have a nice June weekend and Happy Father's day to all the Fathers out there.

Labels: , , , ,

Wednesday, June 16, 2010

Lt. Gen. Russel Honore could lead Gulf Oil Spill cleanup!


Today on CNN's John King program, retired Lt. Gen. Russel Honore said we need to treat the Gulf Oil Spill as a War and mobilize every asset. From the government he said we should mobilize Army troops, the Navy and the Air Force to meet this crisis and take the fight off the shores and back into the Gulf. Honore is best remembered from Hurricane Katrina advisor to the media of New Orleans. He was the main person on the scene and was quite capable to do what was necessary to save lives and resolve problems. The other day I had suggested President Obama mobilize General Schwarzkopf, who headed the Iraq war. I would be just as pleased to have him take this Oil Spill cleanup and Oil floating in the Gulf. But Lt. Gen. Honore could mobilize and coordinate this problem to everyone's satisfaction. He is a man of action.

Labels: , , , , ,

PPI, Housing Starts for May: Not really good, but will it affect the market?

Yesterday was an unusual day in the market. The Dow soared up above the R2 (Resistance) level of 10,377, closing above 10,400 and all on bad news during the day. I had said it wouldn't happen. I was wrong. The Futures were pointing down as the PPI data and Housing Starts data was to be released. The PPI (Producer Price Index) came in at -0.3% compared to being down -0.1% in April, while Housing Starts were down -10%. May Building permits were down -5.9% after being up +3.9% in April.

The PPI numbers continue to support the fact we are in a Deflationary period, contrary to many who believe we are in Inflation. Does it really make a difference? It should as it affects Fed policy, but the stock markets seem to be driven by the beat of a different drummer and we aren't sure who's beating that drum, are we. This stock market even has Cramer scratching his head, as he said on his CNBC Mad Money show yesterday. To quote Cramer, "It makes no sense at all!"

Labels: , , ,

Tuesday, June 15, 2010

Market update June 15th

Lots to talk about today. The Dow has rallied again this morning but so far has not been able to get over the previous high of a few days ago of 10,328 and has made several attempts to climb high and penetrate above R2 resistance level of 10,377. I do not see that happening.

This week is June Options expiration on Friday. To be in the money, they want the S&P 500 to stay in the money above the 1100 level. It has bouncing above and below that for the past 2 days. It is currently at 1103.

Important data coming out tomorrow, Wednesday, on PPI, Core PPI, Industrial Production and Housing Starts. Thursday has Jobless Claims, Consumer Price Index and Core CPI.

The Intraday Dow chart does not reveal much yet but when it does I will post an Update here.

From Europe this morning an interesting bit of information. The Mannheim-based ZEW Center for European Economic research said its index of investor and analyst expectations, which aims to predict developments six months ahead, slumped to 28.7 from 45.8 in May. That compares to economists forecast for a drop to 42. This sounds like a slowdown is coming there and we in the US are expecting "slower growth" in the 3rd and 4th quarters so to me we could go back into the recession.

UPDATE 10:30am PST

As you can see in the chart above, we went higher than the level I commented on earlier today but have not gone over R@ at 10,378 level. Ther eis a "W" pattern as shown above and it is slanted slightly down. So while we are higher right now, we should go below this right leg of the W pattern.

Update 12:15pm

Well, take a look at the "W" pattern I posted above and compare it to the underlined one in red in the previous update. It looks to me that the slant was changed and now there isn't one. No wonder the Dow rallied up. I didn't do any trading during the time so it's not a problem, but could have been if I had.

Labels: , , , ,

Monday, June 14, 2010

June 14 Dow Intraday analysis and updates


The chart above shows we rose sharply and did rise above the slanted first "W" pattern, but now it shows we will head lower from the 2nd "W" pattern sloping downward. The Dow, S&P 500 and the Russell 2000 all broke up over the second level of Resistance levels. Now they have moved back below them and we will go lower.

As you can see above, it did go lower and now has turned up from the 3rd red line under the "W" pattern. It may be turning again shortly but we have settled into a range for the day.


Ok, above, is the last one I am putting up today (Update: adding one more below). It shows me that we are headed lower by the slanted down "W" pattern underlined and might not finish up today. Don't be fooled by those saying we are heading up. You decide.


Update: 11:50am PST
Well, for the record, I called this one correctly, as you can see in the chart above, we are now below the open at -5 on the Dow. The process of identifying "W" patterns should now be something that you can easily do. The challenge is to trade on them. It is difficult to do during the day when you don't have the software built in to help you execute trades. I don't have it either. But the same principle applies to Monthly charts and yearly or any longer timeframes. That is why it is so important to keep the big picture in your mind at all times.

Labels: , ,

Sunday, June 13, 2010

BBC scant reporting today on BP's Gulf Oil Spill.

So check out this mornings front page of the BBC's (British Broadcast Corp.) front page of stories and I dare you to find anything on BP Gulf Oil Spill other than a heading under the Business section reporting BP to discuss Dividend on Monday. Also a small piece under America titled, America urges quicker BP Oil strategy. Nothing is written about the Oil spill in the Gulf and the damage done to our environment. It's atrocious that BBC isn't reporting this as a major headline today. Check it out by clicking here.

Labels: , ,

Who should lead the Gulf Oil spill cleanup?

Well I don't know about you, but I am getting tired of this Gulf Oil well not being capped and not stopping the oil leaking into the gulf. I am also just sick watching those birds covered and barely breathing soaked in oil. Oh, and while I hate watching the oil leaking from those 24/7 robot cameras, I like being reminded what is going on here. I thought it was time for some reflection and dialogue on the subject and the leadership, or lack of it, that is responsible for getting this problem resolved.

Let me start with a question posed from the 2008 political campaigns between then candidates, John McCain, Hillary Clinton and Barack Obama. "Who would you like answering the phone at 3:00am in the White House when there was a crisis? I can tell you one thing, it wouldn't be BP's CEO Tony Hayward! Have you ever seen such incompetence from a company and a CEO? I haven't! But let's get back to the question and apply it to all three Presidential candidates.

There is no doubt now, from what we have learned about John McCain, that we would NOT call on him. McCain, the father of the phrase, "Drill Baby, Drill!" has offered nothing on this problem or any problem since then. The Republicans seem to take pride in the fact they don't offer solutions. They like just saying "No" to everything.

Hillary Clinton, I must admit, has surprised me as Secretary of State. She has done a fairly good job and has learned how to support someone who was her rival and do that with grace. Considering the hole we have been in on the International scene with 2 wars and people hating us all over the world from the Bush/Cheney arrogant leadership style, it is remarkable how she and President Obama have turned this around in such a short time. She is doing a good job and could help this problem if she were in charge as President.

President Obama caught all of our hearts with his Audacity of Hope theme during the election, but many of us who voted for him, wanted more audacity and less hope from him, since being elected. He seems to be playing it safe on every issue, from healthcare to financial reform and now to include the Gulf Oil spill cleanup. No one holds him responsible for the catastrophic explosion which occurred and killed those 11 workers. Nor do we hold him responsible to cap and stop the leak, as the government doesn't have the experts capable to jump in and take that role over. But now we do hold him responsible for ensuring the cleanup is done more swiftly and effectively by ordering and commanding the Oil giants to bring their armada of tools, expertise and people to bear on this cleanup. The fact that he has never really managed in business in a command and control manner, like, for example, Mayor Bloomberg has or Lee Iacocca, formerly CEO of Chrysler, or Jack Welsh, former CEO of GE, is a disadvantage for any President.

Look, don't think I want to bash President Obama, I don't. I do however think his advisors are failing him terribly. And what we need now is some national figure of stature with Command and Control experience to handle this mess for the President. I have one suggestion of the type of individual who could do this, General Norman Schwarzkopf. He has the military experience to handle a crisis and also that added benefit of coordinating with the Navy, since this will involve naval forces. After all we have the largest Navy in the world. And he has the respect of the American people from his service and leadership in the War in Iraq.

He would be perfect for this role and it would take the heat off of President Obama who has his hands full trying to improve jobs and the economy and working with Congress on Financial reform and Cap and Trade. Let's draft the General. Start by promoting his name and send an email to the White House suggesting he be called back from retirement to lead this effort.

And while he is at it, we need to mobilize the population there and across the country to help. We could find things to do with the kids out of school for the summer and offer benefits for college tuition for any who help on a sustained basis. We can do tis as Americans. It can be managed and while it will take a long time to clean up, there is no better time to start than now!

On a side note today: This is my 1300th Blog post since I started this Blog in May of 2005 and a fitting topic. What started me blogging was the fact I was so angry with President Bush and VP Cheney's lack of good leadership by nominating John Bolton for U.N Ambassador and the problems with the use of the Filibuster by Congress

Labels: , , , , , , , ,

Saturday, June 12, 2010

Where are we going?: Latest on the stock market trend both long term and short term

It's time for one of those posts where I take a very lofty view of the stock market and a minute view at the same time and explain to my readers how I look at the market from day to day when trading. To do this I have put up many charts staring as long as a 30 year chart of the Dow to as small as an Intraday of yesterday's trading. I hope this helps you at least see what I see. Let me start with the broad view using the Dow 30 year chart.

As usual, I will look at each chart observing "W" pattern formation. As I have noted here before, these "W" patterns are often referred to as Head and Shoulder patterns. I suggest you read up on on these patterns somewhere like Investopedia, which has a significant wealth of facts and lessons for any investor. Getting back to those "W" patterns, I will underline in red each "W" pattern I want you to be looking at and we will be looking for which way the slant of the line appears to be heading. If the line heads down, it implies the market will follow by going down below the bottom right leg of the "W". If the slant points upward, the market should go up.


Looking now at the Dow 30 year chart above, you will notice the "W" pattern of the stock price and the fact that it is slanted down. To me this means that although we have made highs of 11,000 recently and 14,000 before that, we are headed lower and should go lower than the previous low, which was at 6,400 on the Dow. That seems to contradict conventional wisdom by the "experts" on CNBC and others who have said any correction will go to Dow 8,000. If that were so, then the previous low would not have gone below 8,000 and there would be no slant of the "W" pattern. So that is one thing I wanted you to see along with me. But there is another interesting point to be made on this chart, but it doesn't involve the stock price, but rather, the Volume in the bottom section of the chart.

As you can plainly see, there has been 3 distinct periods where the Volume made a significant step up. I have drawn Blue lines to define each step. The first step was from 1980 to about 1988, the second step up from 1988 to 1998, and the last step up from 1998 to now. But in this last step, it looks to me that the Volume is increasing steadily over this 12 year period .Just think, the Volume was significantly lower just 10-15 years ago in the buildup to the year 2000 Dot.com bubble bursting. I don't know many investors who have increased their purchases of shares over these past 10 years and yet the Volume is over double the previous period. Part of the explanation could be that the bank shares like Citigroup, symbol C, have dropped in value so much that there are Billions of shares traded now compared to previous times, but that doesn't entirely explain it.

To me the only explanation is that the Government has been using its reserves to keep this market sustainable at these levels through firms like Goldman Sachs and others these past 2 years investing with nearly free money from the government. It's a way fro the government to make money too since the wealthy don't want to be taxed.

Anyway, I think this Volume will eventually drop as people get more scared and leave the market as their gambling table of choice. Any major market drop will scare a generation of investors away, as may have happened in the recent drop to 6,400 on the Dow. Ok, now let's move on to another chart.


This next chart above is off the Dow for the past 10 years. I have underlined several "W" patterns to show you again the predictability of this pattern at determining the market direction immediately after the "W" pattern is formed. Several of these in this chart show this to be true. You will notice the last "W" pattern I drew in red to the right of the chart appears to slant down. This will be clearer in shorter time period Dow charts to come. The other thing to look at on this 10 year chart is the volume spike near the low of 6,400, when Volume increases and price is dropping it is very bearish for the market. Same is true when the market is going up on high volume. However, if price rises on low volume, that too is bearish.


This 3rd chart above, shows the Dow for the last 1 year period. I have underlined a number of "W" patterns here as well. As you can see in this last period, the "W" pattern was flat. This implies the Dow moving sideways, not up and not down. It implies a tight range until the next "W" pattern emerges.


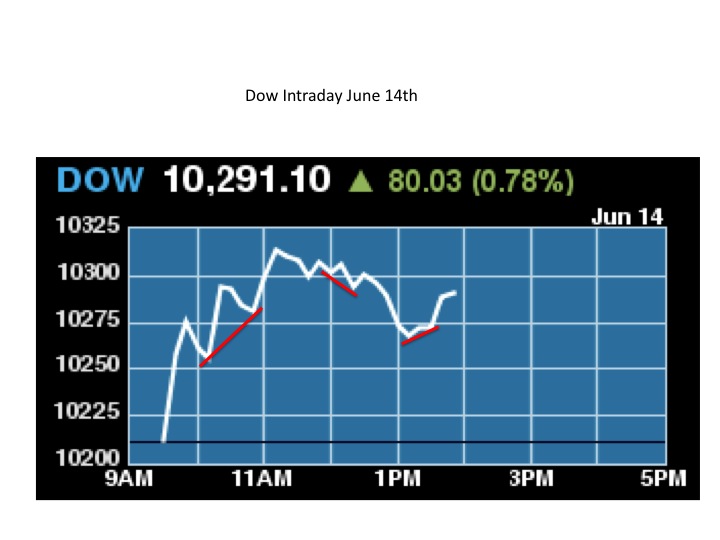
And lastly, the final 1 month chart of the Dow. I have drawn 2 red lines. Let's focus on the last one which points up. We can't tell much form this except that the market should go up from this latest rally the past few days, correct? However, the previous red line under the "W" pattern is slanted down and it has not yet been fulfilled. It may be a fluke. Remember I have said these aren't 100% accurate predictors, but rather about 90%. However, I conclude 2 things from this. First, is that while it might be a fluke, the Dow will not go too high from here. It possibly could go as high as Dow 10,500-10,600 range, as I have mentioned a few weeks ago. However, it may just fizzle out and return to another major drop on any negative trigger. I would be cautious trading here. And Volume is barely hanging in this past week at 200 Million shares where if you look at the 30 year chart it looks like the average for this period should be more than the 200 million shares.

So what do you do when the signals are mixed? I can't tell you what you should do, but I can tell you how I am thinking about it. Because the short term is so murky, I pull back to what I do know. That takes me to look at the 30 year chart. So while I mark time, I keep in mind that the overall trend will be down, so if I am going to buy any stock Puts, I can wait a bit and if the market rises, I should be able to get them cheaper. I most likely won't risk buying any stock Call Options either. And lastly, waiting until there is clarity is just fine as well.

I am sitting on a number of TZA Call Options. My latest purchase was for $1.55 each for a Strike Price of $9.00 for October. I also purchased some Puts on a Dow index stock I will keep nameless.

I hope this isn't boring and has been informative. Good luck out there. Next week the key Leading Economic Indicators I will be watching will be these:

Wednesday PPI, Core PPI, Housing starts, Industrial Production (expect PPI to be negative)

Thursday Jobless Claims, Consumer Price Index, Core CPI (Watch for Deflation in Core CPI numbers)

That's it from here. have a nice weekend. And remember, there is nothing wrong with taking profits and being in cash right now. It is the only safe place to be contrary to the hype out there in my view. To make this point further, click here on a video clip of Maria Bartiromo of CNBC's Closing Bell interviewing Bob Prechter of Elliott Wave International.

Labels: , , , , , , , , ,

Friday, June 11, 2010

June 11 Dow Intraday analysis and Updates throughout the day


The Dow Intraday chart shows we started high and then dropped to down as low as 88 points. It has recovered and looking at the first "W pattern, we were to head higher into positive territory, which didn't make sense given the drop in Retail Sales for May and the biggest drop in 8 months. That's called government intervention and manipulation. But then it formed another "W" pattern and it is pointed down, which does makes sense.

More charts to follow during the day so come back again today and every day.

UPDATE: 10:30am PST
The market has moved like a Yo-Yo today. The latest chart seems to show some positive momentum to try to retain all of yesterday's gains as the "W" patterns seem slanted up for the most part.

Labels: , , , ,

May Retail Sales

May retails Sales numbers released a few minutes ago were disappointing to investors. May's retail Sales were down 1.2% compared to being up 0.6% in April. The Futures are down. The May drop is the biggest in 8 months. Even when you take out Auto's from the data, the numbers are lower. It will be interesting to watch to see how much of yesterday's gains are going to be taken away today. Any bets?

Labels: , ,

Thursday, June 10, 2010

June 10 Intraday market outlook (UPDATES)


Above is the chart of the Dow at 11:00am PST. I have added the red lines under each "W" pattern so we can see what direction the market is taking for the next little while. The first Red line this morning under the "W" pattern showed a slant down, which was fulfilled as the first leg of the second "W" pattern formed. Now this second Red line does slightly slant up. So It looks like a short rally again was in the cards and is now fulfilled. We may form another 3rd "W" pattern from here so look for the direction of the slant to decide any trades. At this point there is no way to determine the direction in the last 2 hours of trading. But I am watching.

I did purchase more TZA Call Options this morning for October Expiration at a Strike Price of $9.00 for a price today of $1.68 each.

UPDATE: 11:45am PST
So the last prediction has manifested itself and the Dow Intraday is up 241 points at this moment. One thing I noticed today is how low the Volume is going into the last hour of trading. Caution, low Volume with price rising is very bearish. I won't get trapped buying stocks right now. I added a Put Option for a stock I will leave unnamed, because the price was right. It was for an October Expiration.


UPDATE 5:00pm PST
The Volume really picked up in the last hour today as did the high for the Dow. This may be the beginning of the rally I had predicted to Dow 10,500-10,600 a few weeks ago. However, this time, I will not try to make any money on this rise from the same things I did a few weeks ago, which was to buy TZA Puts. It is too risky to be betting on a Rally of the market.

Labels: , , , ,

Put to Call ratio chart compared to the Dow


I thought today I would post a chart of the Put to Call ratio from January 1st, 2008 to the close of yesterday's trading. On this chart I have drawn 3 red lines to show the shifts this ratio has made. The recent shift occurred similarly back in March and October of 2008, when the market signaled it would reverse the trend and go down sharply. I am of the opinion that this 3rd shift up in the Put to Call ratio is the canary in the coal mine that portends of the market drop similar to 2008.

I have also posted the Dow for the same time period with arrows on key dates for comparison. The pause in the current market decline is temporary and while it is tempting to me to buy some Call options on some stocks, it is a foolish thought, as the overall trend in the market is negative.


As you can see from this 2010 Put to Call ratio chart above that we are defintely in a higher period as more and more people are not believing all the hype that things are getting better and the recovery is stable right now. This would indicate to me that people don't believe it as they are buying more Puts to protect themselves. It's the mood of people stupid! It is negative!

It would be a better use of my time to Buy some various Put Options on stocks or Indexes, or buying Calls on TZA. Remember, TZA is already a an Ultra Short ETF which goes triple the daily move of the Russell 2000. Good luck out there today. The Futures point up after a benign Jobs report this morning. I may post additionally today Intraday charts and analysis. So check back.

Labels: , , , ,

Wednesday, June 09, 2010

June 9th Dow Intraday report (UPDATE)


AS you can see from the chart above, the Intraday chart is showing the next move is down on the Dow. So if you are going to sell into the rally, now is the time. As you can see the first red line showed the Dow should go up as the "W" pattern slanted upward. The second red line shows the slant pointing down. Now the Dow did drop below the "W", but we may be forming another "W". Watch to see if this happens as the market would then go lower again.


UPDATE 5:15PM PST
Ok, the chart above of the Dow intraday shows clearly the Dow went down from the previous entry. You can see that for every "W" pattern today, and there were 4, if the slant of the red line was up, immediately after the "W" the Dow went up. Conversely, if the slant was down, the Dow went down. This is true about 95% of the time. So when I said it was time to sell in my comment in the previous paragraph, it was the right time to sell. I took advantage of my own prediction and sold some shares of stocks that I wanted to unload and raise more cash for buying Options. Stay tuned!

Labels: , ,

Thanks!

I wanted to thank all my readers, as today I reached a total of 56,000 Visitors to my site who read over 89,000 pages. I hope you have learned something about the stock market, politics and have enjoyed the visit. Thanks!

I am off to play Golf this morning, so won't be posting on the market today until 11:30am PST or 2:30pm EST.

Labels: , , ,

Tuesday, June 08, 2010

Dow Intraday pointing down while TZA pointing up (Update)


The Dow Intraday chart today, June 8th, is pointing to go lower, as can be seen by the chart above. As you can see by my identification of the "W" pattens and the slant of the "W" the direction to follow.

In addition I have placed a 2 month chart of TZA. For those new here, TZA is an ETF Ultra Short of the Russell 2000 Index. It is a Triple movement Ultra Short. TZA goes in the opposite direction of the Russell. So if the Russell 2000 drops 1%, TZA goes up 3%. As you can see from the chart below, this "W" pattern is slanted up and so is TZA. It has made a breakout to the upside. You might even want to look at a 1 year chart of TZA. Do yuo think money could be made here? :)


UPDATE 12:30pm
Well as you look at the Intraday of the Dow below you can see the last "W" pattern is slanting down. This usually says we are going lower than the bottom right leg of the "W". Notice the other "W" patterns did follow through on the direction of the slant after the "W" was formed. We shall see!


Update: 1:15pm Market closed
Well I made a mistake as I was in too much of a rush today in my last 1/2 hour update. I missed the larger "W" pattern which had formed and was so focused on the tiny one I forgot that the larger "W pattern slanted up. I drew it in with a Red dash line. I am very sorry for the error. I will take my time next time and not rush. No excuses. I'm just surprised that no one called me on it and pointed it out. You had your chance. Next time. :)

Labels: , , ,

Tuesday June 8th stock market outlook


I have put together a 6 month chart of the Dow, including the latest "W" pattern trend and also posted the chart of my prediction of market direction on the 2 month chart. We will have small rallies in the market but they will only be opportunities to sell what you haven't yet or to buy Put Options to short this market. The trend is even obvious to the casual market follower. Nervousness has started to take over the main psychology and it will gain strength as many decide to abandon their least favorite stocks in this beginning phase.

I sold my MGM Put Options after a one day gain of 28%. I figured those don't come by that often. I will get a chance to buy them back at the price I bought them at on Friday which was $1.12. Selling at $1.40 in one day I couldn't pass up.

Labels: , , , , , , ,

Sunday, June 06, 2010

Monday June 7th Pre-market

Futures are down as the Nikkei plunges. Currently down almost 400 points at 8:46pm June 6th. It is going to be a follow on crazy day of market action. But it is consistent with the reality of the economic conditions facing us and Europe. European leaders seem to be bickering over the direction of monetary policy of the EU. Tim Geithner, Treasury Secretary is pleading with them to implement a Debt rescue plan, according to reports this weekend on Bloomberg.com. Check in during the day Monday for updates and intraday chart analysis.

Labels: , , , , ,

Saturday, June 05, 2010

Overall Stock Market outlook, analysis and commentary.

I have 4 charts to present to you today. The first is the closing Intraday Dow chart of yesterday's market action and the second is a 30 year chart of the Dow. The 3rd is a 30 year chart of the Nasdaq. These time extremes are fascinating to compare, as they truly do show the similarity of chart patterns and can be predictive of the future direction of the market. The last chart is of our National Debt and I will save that for the end.


So starting with yesterday's chart above, you can clearly see we did not close at the lows of the day, but not by much. In fact, one half hour before the closing bell yesterday, I said it would be important for those of us on the Short size of this market, to see the Dow close between 35 and 50 points above the close. If it closed at the lows I said, we would have created a Hammer candlestick pattern and the market would reverse next week and rise again. But the market closed up 42.09 points above the low for the day which was 9,889.88, closing at 9,931.97 which is between 35 and 50 points.


The "W" patterns I have drawn with Red lines in previous posts these past few weeks should have given you confidence that you can draw these as well as I can and that they are truly predictors of future direction in the short term. The same is true when looking at charts over very long time frames. Turn your attention above, to the 30 year Dow chart now and look at the developing large "W" pattern which is in the process of finishing its last leg. The "W" is clearly slanted down and you know what that means, we are headed lower than the lowest leg of the "W". So yesterday's action, coupled with the drop the past month or so, do point to a turn of significant importance.

Many don't believe in reading charts. They think it is a waste of time. They say they like the Fundamentals. But what they don't factor in is Investor Mood. Investor mood has been sour for the past 10 years since the Dot.com bust. That's at least true of my generation. We have been investing in the stock market since the 60's and 70's and got a real shake when the bubble burst. It affected us like the Great Depression affected our folks but not to the same extent. Well, we may still have the same affect as this market continues to go down over the next several years. This is why I have been warning many readers and friends now for almost a year. During the year 2000, I remember warning many in a Newsletter I was writing weekly. Friends said I was crazy to get out of the market when the Nasdaq was at 4,200 range climbing that steep wall towards 5,000 when I sounded the alarm to go to 100% cash. They said "Good money was still to be made and I should get some of it. I was busy selling into repeated rallies until I was 100% cash and then only buying Put Options and waiting. Then it came and many were wiped out of their life savings. Very sad, as greed had won over fear until the crash.


As you can see from the 30 year chart of the Nasdaq above, we have never recovered from it. You can see that there is a "W" pattern, which I have underlined in Red. You can also see that this "W" pattern is almost flat. When the "W" pattern is flat it means that we will eventually stay flat and go back to that flat line which will be the new support level. That indicates that when the Dow does drop and retest the lows and goes below them, the Nasdaq should return to about 1,100-1,200 and not go below that level. We closed at 2,219 yesterday; that's a 50% decline from here. The Nasdaq did go as low as 1,300 or so in 2008 and that is its low to retrace to. So it is not impossible to wipe out all the recent gains of the past year on the Nasdaq as easily as the Dow.

So what to do? Again, as I have said before, there is nothing wrong with taking profits off the table. I did this week on my TZA Put Options on Thursday, perfectly timing the gains before the big drop. You can do the same. This is not Rocket science. It is not as difficult as plugging the hole in the floor of the Gulf. If you have the time, you can learn how to do this and save and protect your assets. Even Jim Cramer on CNBC's Mad Money show yesterday, has said the markets are going down next week and to take some profit as a strategy for protecting your nest egg. It is time now not to delay as hard times are coming.

Now let me dispel one notion. I do not want the markets to go down any more than you do. All I am trying to do is not to stand in the stream and try to fight the current. My strategy is to move with the current and flow. I try to ascertain when the current is changing direction, so I can move with it. I AM NOT TRYING TO INFLUENCE THE COURSE OF THE RIVER! It is the world leadership, which has set in place the conditions which will precipitate this calamity.


I know I may offend some here with this view, but, In my view, it started during the Reagan presidency when we had massive tax cuts for the wealthy and built a debt which has gotten way out of control. We can agree that for the most part, no one Party or President has really lowered the debt since Ronald Reagan and maybe even Carter, if you look at the chart above. Some of it was from deregulation for sure. It's our fault as citizens for not holding our elected officials' feet to the fire and for not paying for things we should be paying for or not having them in the first place. The war in Iraq comes to mind here.

But I will let historians argue over the causes of this impending setback to our easy way of life. Although many are now suffering because of unemployment, lost savings for retirement, or some major health issue which made them bankrupt. The suffering is out of view and we don't want to look at it any more like we are not wanting to look at those birds covered in Oil from the Gulf.

To get grounded back into the market conversation, I just ask you to contemplate this question: Would you agree that things don't look that promising out there for any stock market rally? Then what are you waiting for, another kick on the side of your head (pocketbook)? If you need more convincing, go back a few days and read my post on the Positives and Negatives in the World today and make up your own mind. I am only trying to help you face reality so you don't suffer any more. You can't blame me for trying.

One last word, this decline may play out over a number of years as nothing. Even the year 2000 drop of the Nasdaq took some time to bottom out, as it was in late 2002 when that interim bottom was hit. This will take a comparable amount of time. There will be short rallies to play if you have the time to devote to the market, but it will be trading, not investing. The overall long term trend is down! Just keep that in mind, as you trade. It will be for survival.

Labels: , , , ,

Technorati Profile